You determined there was a positive correlation between the number of study hours a week a student spends studying and their overall grade at the end of the semester. You determined the regression equation:ŷ = 2.072x+49, where x is the number of hours a student spends studying each week. What would be the predicted overall test score for a student who studies 11 hours a week?
You determined there was a positive correlation between the number of study hours a week a student spends studying and their overall grade at the end of the semester. You determined the regression equation:ŷ = 2.072x+49, where x is the number of hours a student spends studying each week. What would be the predicted overall test score for a student who studies 11 hours a week?

Chapter6: Exponential And Logarithmic Functions
Section6.8: Fitting Exponential Models To Data
Problem 1TI: Table 2 shows a recent graduate’s credit card balance each month after graduation. a. Use...

Related questions
Question
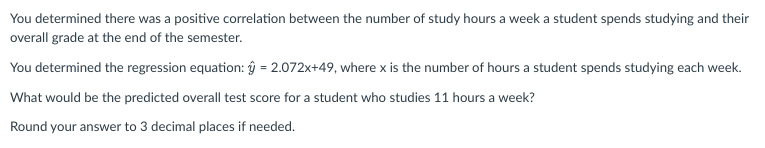
Transcribed Image Text:You determined there was a positive correlation between the number of study hours a week a student spends studying and their
overall grade at the end of the semester.
You determined the regression equation: 4 = 2.072x+49, where x is the number of hours a student spends studying each week.
What would be the predicted overall test score for a student who studies 11 hours a week?
Round your answer to 3 decimal places if needed.
Expert Solution
This question has been solved!
Explore an expertly crafted, step-by-step solution for a thorough understanding of key concepts.

Step by step
Solved in 2 steps

Recommended textbooks for you

Algebra for College Students
Algebra
ISBN:
9781285195780
Author:
Jerome E. Kaufmann, Karen L. Schwitters
Publisher:
Cengage Learning
Algebra for College Students
Algebra
ISBN:
9781285195780
Author:
Jerome E. Kaufmann, Karen L. Schwitters
Publisher:
Cengage Learning