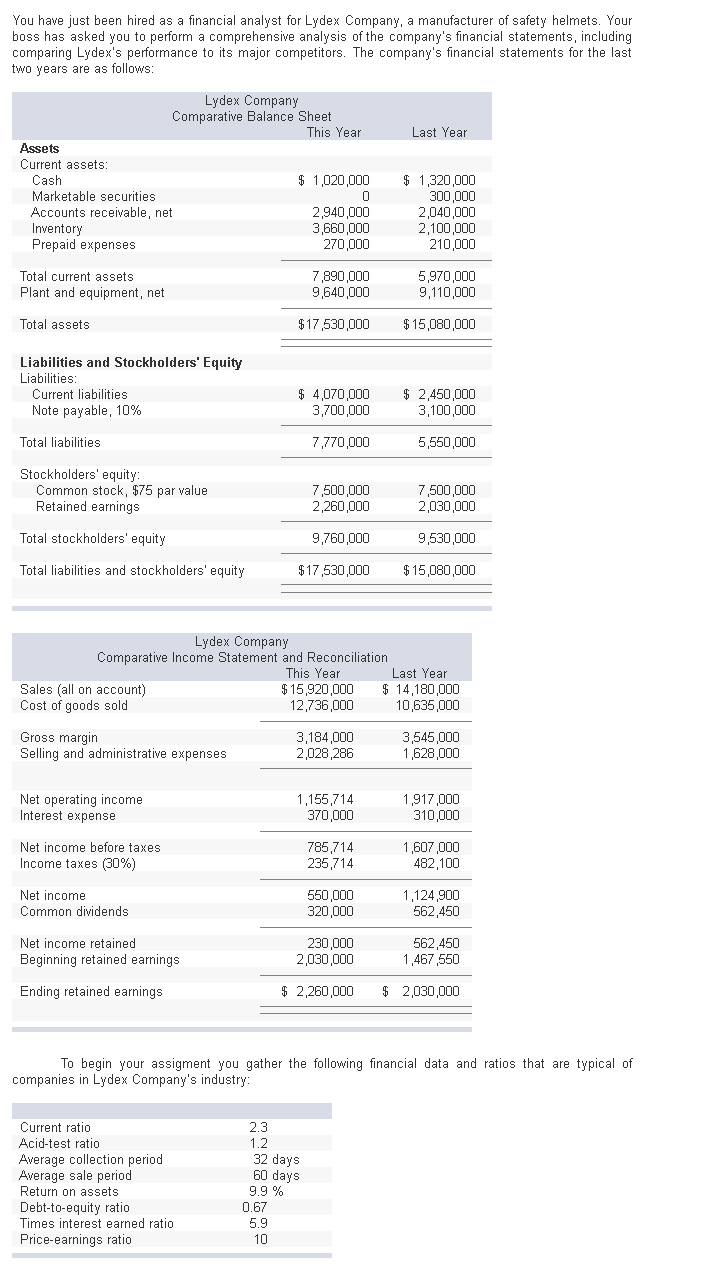
You have just been hired as a financial analyst for Lydex Company, a manufacturer of safety helmets. Your boss has asked you to perform a comprehensive analysis of the company's financial statements, including comparing Lydex's performance to its major competitors. The company's financial statements for the last two years are as follows: Lydex Company Comparative Balance Sheet This Year Last Year Assets Current assets: $ 1,020,000 Cash Marketable securities Accounts receivable, net Inventory 2,940,000 3,660,000 270,000 $ 1,320,000 300,000 2,040,000 2,100,000 210,000 Prepaid expenses Total current assets 7,890,000 9,640,000 5,970,000 9,110,000 Plant and equipment, net Total assets $17,530,000 $ 15,080,000 Liabilities and Stockholders' Equity Liabilities: $ 4,070,000 3,700,000 $ 2,450,000 3,100,000 Current liabilities Note payable, 10% Total liabilities 7,770,000 5,550,000 Stockholders' equity: Common stock, $75 par value Retained earnings 7,500,000 2,260,000 7.500,000 2,030,000 Total stockholders' equity 9,760,000 9,530,000 Total liabilities and stockholders' equity $17,530,000 $ 15,080,000 Lydex Company Comparative Income Statement and Reconciliation This Year Sales (all on account) Cost of goods sold $ 15,920,000 12,736,000 Last Year $ 14,180,000 10,635,000 Gross margin Selling and administrative expenses 3,184,000 2,028,286 3,545,000 1,628,000 Net operating income Interest expense 1,155,714 370,000 1,917,000 310,000 Net income before taxes Income taxes (30%) 785,714 235,714 1,607,000 482,100 Net income Common dividends 550,000 320,000 1,124,900 562,450 Net income retained Beginning retained earnings 562,450 1,467,550 230.000 2,030,000 Ending retained earnings $ 2,260,000 $ 2,030,000 To begin your assigment you gather the following financial data and ratios that are typical of companies in I ydex Company's industry
You have just been hired as a financial analyst for Lydex Company, a manufacturer of safety helmets. Your boss has asked you to perform a comprehensive analysis of the company's financial statements, including comparing Lydex's performance to its major competitors. The company's financial statements for the last two years are as follows: Lydex Company Comparative Balance Sheet This Year Last Year Assets Current assets: $ 1,020,000 Cash Marketable securities Accounts receivable, net Inventory 2,940,000 3,660,000 270,000 $ 1,320,000 300,000 2,040,000 2,100,000 210,000 Prepaid expenses Total current assets 7,890,000 9,640,000 5,970,000 9,110,000 Plant and equipment, net Total assets $17,530,000 $ 15,080,000 Liabilities and Stockholders' Equity Liabilities: $ 4,070,000 3,700,000 $ 2,450,000 3,100,000 Current liabilities Note payable, 10% Total liabilities 7,770,000 5,550,000 Stockholders' equity: Common stock, $75 par value Retained earnings 7,500,000 2,260,000 7.500,000 2,030,000 Total stockholders' equity 9,760,000 9,530,000 Total liabilities and stockholders' equity $17,530,000 $ 15,080,000 Lydex Company Comparative Income Statement and Reconciliation This Year Sales (all on account) Cost of goods sold $ 15,920,000 12,736,000 Last Year $ 14,180,000 10,635,000 Gross margin Selling and administrative expenses 3,184,000 2,028,286 3,545,000 1,628,000 Net operating income Interest expense 1,155,714 370,000 1,917,000 310,000 Net income before taxes Income taxes (30%) 785,714 235,714 1,607,000 482,100 Net income Common dividends 550,000 320,000 1,124,900 562,450 Net income retained Beginning retained earnings 562,450 1,467,550 230.000 2,030,000 Ending retained earnings $ 2,260,000 $ 2,030,000 To begin your assigment you gather the following financial data and ratios that are typical of companies in I ydex Company's industry

Financial And Managerial Accounting
15th Edition
ISBN:9781337902663
Author:WARREN, Carl S.
Publisher:WARREN, Carl S.
Chapter4: The Accounting Cycle
Section: Chapter Questions
Problem 2MAD: Analyze and compare Zynga, Electronic Arts, and Take-Two Data (in millions) from recent financial...

Related questions
Question
Transcribed Image Text:You have just been hired as a financial analyst for Lydex Company, a manufacturer of safety helmets. Your
boss has asked you to perform a comprehensive analysis of the company's financial statements, including
comparing Lydex's performance to its major competitors. The company's financial statements for the last
two years are as follows:
Lydex Company
Comparative Balance Sheet
This Year
Last Year
Assets
Current assets:
Cash
$ 1,020,000
$ 1,320,000
300,000
2,040,000
2,100,000
210,000
Marketable securities
Accounts receivable, net
Inventory
Prepaid expenses
2,940,000
3,660,000
270,000
7,890,000
9,640,000
5,970,000
9,110,000
Total current assets
Plant and equipment, net
Total assets
$17,530,000
$ 15,080,000
Liabilities and Stockholders' Equity
Liabilities:
Current liabilities
$ 4,070,000
3,700,000
$ 2,450,000
3,100,000
Note payable, 10%
Total liabilities
7,770,000
5,550,000
Stockholders' equity:
Common stock, $75 par value
Retained earnings
7,500,000
2,260,000
7,500,000
2,030,000
Total stockholders' equity
9,760,000
9,530,000
Total liabilities and stockholders' equity
$17,530,000
$ 15,080,000
Lydex Company
Comparative Income Statement and Reconciliation
This Year
Sales (all on account)
Cost of goods sold
$ 15,920,000
12,736,000
Last Year
$ 14,180,000
10,635,000
Gross margin
Selling and administrative expenses
3,184,000
2,028,286
3,545,000
1,628,000
Net operating income
Interest expense
1,155,714
370,000
1,917,000
310,000
Net income before taxes
785,714
235,714
1,607,000
482,100
Income taxes (30%)
550,000
320,000
1,124,900
562,450
Net income
Common dividends
Net income retained
Beginning retained earnings
230.000
562,450
1,467,550
2,030,000
Ending retained earnings
$ 2.260.000
$ 2,030,000
To begin your assigment you gather the following financial data and ratios that are typical of
companies in Lydex Company's industry:
Current ratio
Acid-test ratio
Average collection period
Average sale period
Return on assets
2.3
1.2
32 days
60 days
9.9 %
Debt-to-equity ratio
Times interest earned ratio
0.67
5.9
Price-earnings ratio
10
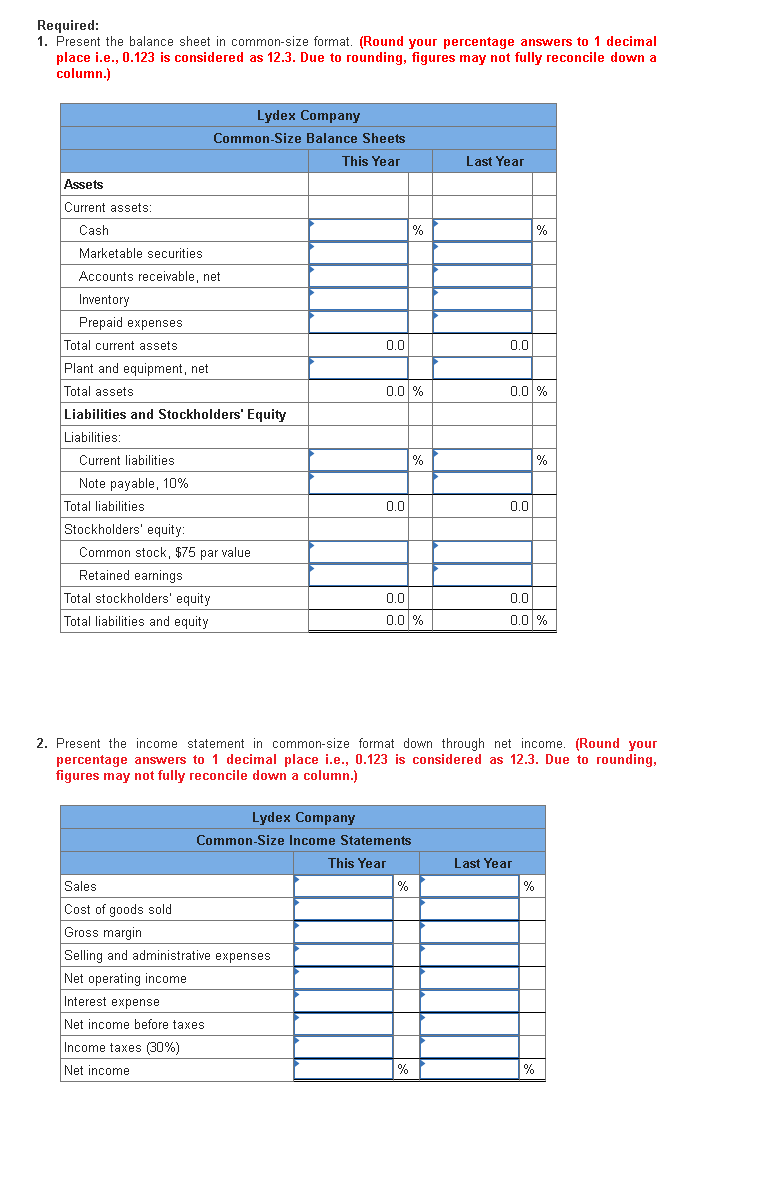
Transcribed Image Text:Required:
1. Present the balance sheet in common-size format. (Round your percentage answers to 1 decimal
place i.e., 0.123 is considered as 12.3. Due to rounding, figures may not fully reconcile down a
column.)
Lydex Company
Common-Size Balance Sheets
This Year
Last Year
Assets
Current assets:
Cash
%
%
Marketable securities
Accounts receivable, net
Inventory
Prepaid expenses
Total current assets
0.0
0.0
Plant and equipment, net
Total assets
0.0 %
0.0 %
Liabilities and Stockholders' Equity
Liabilities:
Current liabilities
%
Note payable, 10%
Total liabilities
0.0
0.0
Stockholders' equity:
Common stock, $75 par value
Retained earnings
Total stockholders' equity
0.0
0.0
Total liabilities and equity
0.0 %
0.0 %
2. Present the income statement in common-size format down through net income. (Round your
percentage answers to 1 decimal place i.e., 0.123 is considered as 12.3. Due to rounding,
figures may not fully reconcile down a column.)
Lydex Company
Common-Size Income Statements
This Year
Last Year
Sales
%
%
Cost of goods sold
Gross margin
Selling and administrative expenses
Net operating income
Interest expense
Net income before taxes
Income taxes (30%)
Net income
%
%
Expert Solution
This question has been solved!
Explore an expertly crafted, step-by-step solution for a thorough understanding of key concepts.

This is a popular solution!

Trending now
This is a popular solution!

Step by step
Solved in 2 steps with 2 images

Recommended textbooks for you
Financial And Managerial Accounting
Accounting
ISBN:
9781337902663
Author:
WARREN, Carl S.
Publisher:
Cengage Learning,

Managerial Accounting: The Cornerstone of Busines…
Accounting
ISBN:
9781337115773
Author:
Maryanne M. Mowen, Don R. Hansen, Dan L. Heitger
Publisher:
Cengage Learning

Financial And Managerial Accounting
Accounting
ISBN:
9781337902663
Author:
WARREN, Carl S.
Publisher:
Cengage Learning,
Managerial Accounting: The Cornerstone of Busines…
Accounting
ISBN:
9781337115773
Author:
Maryanne M. Mowen, Don R. Hansen, Dan L. Heitger
Publisher:
Cengage Learning

Financial Accounting
Accounting
ISBN:
9781337272124
Author:
Carl Warren, James M. Reeve, Jonathan Duchac
Publisher:
Cengage Learning

Financial Accounting
Accounting
ISBN:
9781305088436
Author:
Carl Warren, Jim Reeve, Jonathan Duchac
Publisher:
Cengage Learning
Principles of Accounting Volume 1
Accounting
ISBN:
9781947172685
Author:
OpenStax
Publisher:
OpenStax College