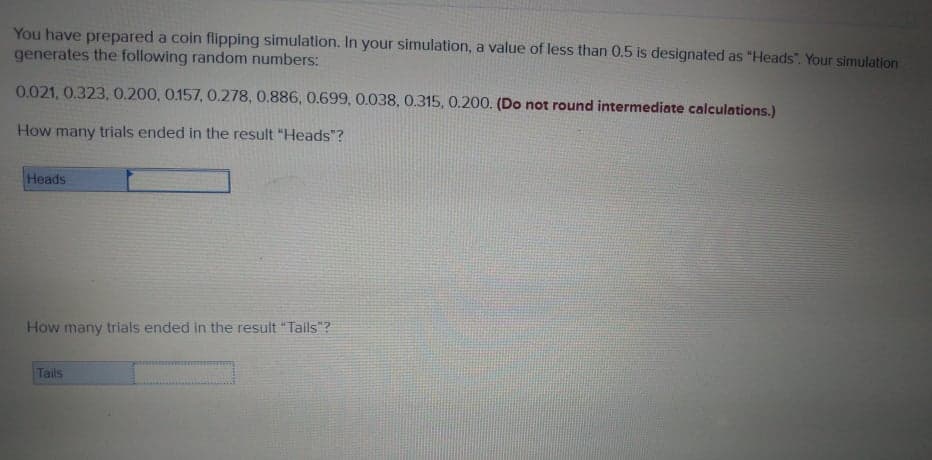
You have prepared a coin flipping simulation. In your simulation, a value of less than 0.5 is designated as "Heads". Your simulation generates the following random numbers: 0.021, 0.323, 0.200, 0.157, 0.278, 0.886, 0.699, 0.038, 0.315, 0.200. (Do not round intermediate calculations.) How many trials ended in the result "Heads"? Heads How many trials ended in the result "Talls"?


Q: Consider the sports ratings model . If you were going to give more recent games more weight, how…
A: The sports ratings model calculates the ratings of a sports team based on actual and predicted point…
Q: The management of the Keribels Company wishes to apply the Miller-Orr model to manage its cash…
A: Given data, Transaction cost =$100 Cash flow variance=75000 I =0.05%
Q: A computer reseller needs to decide how many laptops to order next month. The lowest end laptop…
A: From the above mentioned information the demand probabilities for, P (0) = 0.3, P (1) = 0.4, P(2)…
Q: You have prepared a coin flipping simulation. In your simulation, a value of less than 0.5 is…
A: ANSWER : Given the value less then 0.5 is designated as " Heads " 0.180 Heads 0.571 Tails…
Q: he probability that a mobile phone is stolen in an electronic shop is 0.0008. If 8500 mobile phones…
A: Quality refers to the degree of excellence of something. Quality has some standard on the basis of…
Q: A hardware company sells a lot of low-cost, highvolumeproducts. For one such product, it is…
A: given, low sales = 60,000 high sales = 100,000 variable cost per unit 25% chance of = $6…
Q: A television network earns an average of $65 million each season from a hit program and loses an…
A: We need to find the following: P(Predict a hit) & P(Predict a flop) We know thet P(hit)=0.3 and…
Q: A television network earns an average of $25 million each season from a hit program and loses an…
A: For a value of C = $160,000, build a precision tree by the procedure given below, 1. Precision tree…
Q: Suppose you are a financial analyst and your company runs many simulation models to estimate the…
A: Simulation modeling: A simulation model is a computerized model that would depict or imitate a…
Q: The manager of a restaurant chain in Izmir is trying to decide on the types and amounts of…
A: Given information, Television Commercial cost = 30000 Customers = 50,000 Potential customers for…
Q: The aim of the objective function for Attaran Corporation should be to Maximize the objective value.…
A: Let number of portable Air conditioners manufactured be x and number of portable heaters…
Q: We must invest all our money in two stocks: x and y.The variance of the annual return on one share…
A:
Q: You have prepared a coin flipping simulation. In your simulation, a value of less than 0.5 is…
A: In this question, we have to calculate the number of trials required for head and tail. Random…
Q: A contractor submits a bid on a project for which more research and development work needs to be…
A: A standard deviation is a statistic that measures a dataset's dispersion from the mean. By…
Q: You own a coffee shop in a metro Toronto shopping mall. It is Friday evening and you are trying to…
A: We have to find the value of payoff for quality baked(Q)+demand(D) by using below formula
Q: Toby’s Trucking Company determined that the distance travelled per truck per year is normally…
A: Proportion is the amount or figure which is in between and mixes of the variables. Here in this…
Q: A television network earns an average of $65 million each season from a hit program and loses an…
A:
Q: andrew thomas , a sandwich vendor at hard rock cafe 's annual rockfest, created a table of…
A: given possibility of big demand =0.3 possibility of Average demand =0.5 possibility of small demand…
Q: Select the least accurate statement regarding simulation. In a simulation, correlation between two…
A: In insights, connection or reliance is any factual relationship, if causal, between two arbitrary…
Q: If a simulation begins with the first random number, the first simulated value would be: Random…
A: Calculation of cumulative frequencies; Demand Frequency Cumulative frequency 0 0.15 0.15 1…
Q: A particular automobile costs an average of $21,755 in the Pacific Northwest. The standard deviation…
A: A random sample is a sample of the population where the variables in the samples are taken randomly.…
Q: A metropolitan school system consists of three districts—north, south, and central. The north…
A: A metropolitan school has different district where students studies, They have given details of…
Q: A forest consists of two types of trees: those that are 0–5 ft and those that are taller than 5 ft.…
A: Step 1: As each year 40% of all 0-5ft trees die and other 10% are sold. That means the probability…
Q: True or False: If our explanatory variables do not vary, our model will produce no estimates
A: In regression analysis, there are explanatory variables and response variables. Explanatory…
Q: The output distribution form(s) of the input distribution(s) are generally fairly straightforward to…
A: A correlation matrix must always have 1s along its diagonal and figures between -1 and +1 elsewhere…
Q: We are considering investing in three stocks. The randomvariable Si represents the value one year…
A:
Q: Which of the following is true? a)The maximin criterion is an approach in Optimization under…
A: The Maximin criterion is an approach in optimization under uncertainty which finds a solution with…
Q: Appliances Unlimited (AU) sells refrigerators. Anyrefrigerator that fails before it is three years…
A: Warranty refers to a facility that is provided to consumers in case of any malfunctioning product…
Q: The unit price is 50$. The company produces 50000 units per month. The unit cost follows a…
A: THE ANSWER IS AS BELOW:
Q: The members of a private golf club have handicaps that are normally distributedwith mean 15 and…
A: Hence, the standard deviation of sample mean is 1.75.
Q: Why is the RISKCORRMAT function necessary?How does @RISK generate random inputs by default,that is,…
A: RISKCORMMAT is considered as an function that helps in correlating two or more variables in the…
Q: You have $50,000 to invest in three stocks. Let Ri be the random variable representing the annual…
A: The question can be solved using Excel solver. Objective: To find a minimum variance (minimum risk)…
Q: A trust officer at the Blacksburg National Bank needs to determine how to invest $100,000 in the…
A: Given data: Bond Annual Return Maturity Risk Tax-Free A 9.5% Long High Yes…
Q: Given the model in the Multiserver Simulation.xlsmfile, what unit cost parameters should be used if…
A: Simulation is an important tool for addressing the complicated problems of managerial…
Q: What is the difference between the independent and dependent variable? How do you determine which…
A: A variable is a particular trademark or amount that can be estimated and is countable. Variables…
Q: Select the least accurate statement regarding RISKSIMTABLE. RISKSIMTABLE is a feature that is…
A: The RiskSimtable function is used to enter a list of values which is used to enter a list of values,…
Q: Based on Morrison and Wheat (1984). When his team is behind late in the game, a hockey coach usually…
A: There are two teams having average of 0.05 goals per minute. If goalkeeper is pulled out, your score…
Q: The management of the Keribels Company wishes to apply the Miller-Orr model to manage its cash…
A: Given data, Transaction cost =$100 Cash flow variance=75000 I =0.05%
Q: In the time interval between t and t 1 seconds beforethe departure of Braneast Airlines Flight 313,…
A: The capacity of Flight is 100 passengers Duration is (t tp t-1) seconds the reservation probability…
Q: You have prepared a coin flipping simulation. In your simulation, a value of less than 0.5 is…
A: Below is the solution:-
Q: Do the following problems using either TreePlan A student is deciding which scholarships (out of…
A: A decision tree identify the best decision from all possible alternative based on the consideration…
Q: The manager of a bakery knows that the number of chocolate cakes he can sell on any given day is a…
A:
Q: MacBurger has just opened a fast-food restaurant inBloomington. Currently, i0 customers frequent…
A: Currency Frequency of Mac Burger is i_{0} customers and (N-i_{0}) customers frequent another…
Q: A researcher wants to study the effect of a price change on the sales of various brands of a certain…
A: given,
Q: When preforming sensitivity analysis, it is possible for your objective function value to change…
A: \The opportunity/reduced cost of a given decision variable are often interpreted because the rate at…
Q: A group of 5 players play the following game. Each writes down a positive integer that is less than…
A: ANSWER:
Q: Which of the following interpretations is correct about risk versus uncertainty? Risk is about…
A: Risk is described as the state of gaining or losing something good. Uncertainty is a situation where…
Q: You have prepared a coin flipping simulation. In your simulation, a value of less than 0.5 is…
A: In a random experiment, the probability is an indicator of how likely an occurrence is to take…


Trending now
This is a popular solution!

Step by step
Solved in 2 steps

- If you want to replicate the results of a simulation model with Excel functions only, not @RISK, you can build a data table and let the column input cell be any blank cell. Explain why this works.Suppose you begin year 1 with 5000. At the beginning of each year, you put half of your money under a mattress and invest the other half in Whitewater stock. During each year, there is a 40% chance that the Whitewater stock will double, and there is a 60% chance that you will lose half of your investment. To illustrate, if the stock doubles during the first year, you will have 3750 under the mattress and 3750 invested in Whitewater during year 2. You want to estimate your annual return over a 30-year period. If you end with F dollars, your annual return is (F/5000)1/30 1. For example, if you end with 100,000, your annual return is 201/30 1 = 0.105, or 10.5%. Run 1000 replications of an appropriate simulation. Based on the results, you can be 95% certain that your annual return will be between which two values?The method for rating teams in Example 7.8 is based on actual and predicted point spreads. This method can be biased if some teams run up the score in a few games. An alternative possibility is to base the ratings only on wins and losses. For each game, you observe whether the home team wins. Then from the proposed ratings, you predict whether the home team will win. (You predict the home team will win if the home team advantage plus the home teams rating is greater than the visitor teams rating.) You want the ratings such that the number of predictions that match the actual outcomes is maximized. Try modeling this. Do you run into difficulties? (Remember that Solver doesnt like IF functions.) EXAMPLE 7.8 RATING NFL TEAMS9 We obtained the results of the 256 regular-season NFL games from the 2015 season (the 2016 season was still ongoing as we wrote this) and entered the data into a spreadsheet, shown at the bottom of Figure 7.38. See the file NFL Ratings Finished.xlsx. (Some of these results are hidden in Figure 7.38 to conserve space.) The teams are indexed 1 to 32, as shown at the top of the sheet. For example, team 1 is Arizona, team 2 is Atlanta, and so on. The first game entered (row 6) is team 19 New England versus team 25 Pittsburgh, played at New England. New England won the game by a score of 28 to 21, and the point spread (home team score minus visitor team score) is calculated in column J. A positive point spread in column J means that the home team won; a negative point spread indicates that the visiting team won. The goal is to determine a set of ratings for the 32 NFL teams that most accurately predicts the actual outcomes of the games played.
- It is surprising (but true) that if 23 people are in the same room, there is about a 50% chance that at least two people will have the same birthday. Suppose you want to estimate the probability that if 30 people are in the same room, at least two of them will have the same birthday. You can proceed as follows. a. Generate random birthdays for 30 different people. Ignoring the possibility of a leap year, each person has a 1/365 chance of having a given birthday (label the days of the year 1 to 365). You can use the RANDBETWEEN function to generate birthdays. b. Once you have generated 30 peoples birthdays, how can you tell whether at least two people have the same birthday? One way is to use Excels RANK function. (You can learn how to use this function in Excels online help.) This function returns the rank of a number relative to a given group of numbers. In the case of a tie, two numbers are given the same rank. For example, if the set of numbers is 4, 3, 2, 5, the RANK function returns 2, 3, 4, 1. (By default, RANK gives 1 to the largest number.) If the set of numbers is 4, 3, 2, 4, the RANK function returns 1, 3, 4, 1. c. After using the RANK function, you should be able to determine whether at least two of the 30 people have the same birthday. What is the (estimated) probability that this occurs?Although the normal distribution is a reasonable input distribution in many situations, it does have two potential drawbacks: (1) it allows negative values, even though they may be extremely improbable, and (2) it is a symmetric distribution. Many situations are modelled better with a distribution that allows only positive values and is skewed to the right. Two of these that have been used in many real applications are the gamma and lognormal distributions. @RISK enables you to generate observations from each of these distributions. The @RISK function for the gamma distribution is RISKGAMMA, and it takes two arguments, as in =RISKGAMMA(3,10). The first argument, which must be positive, determines the shape. The smaller it is, the more skewed the distribution is to the right; the larger it is, the more symmetric the distribution is. The second argument determines the scale, in the sense that the product of it and the first argument equals the mean of the distribution. (The mean in this example is 30.) Also, the product of the second argument and the square root of the first argument is the standard deviation of the distribution. (In this example, it is 3(10=17.32.) The @RISK function for the lognormal distribution is RISKLOGNORM. It has two arguments, as in =RISKLOGNORM(40,10). These arguments are the mean and standard deviation of the distribution. Rework Example 10.2 for the following demand distributions. Do the simulated outputs have any different qualitative properties with these skewed distributions than with the triangular distribution used in the example? a. Gamma distribution with parameters 2 and 85 b. Gamma distribution with parameters 5 and 35 c. Lognormal distribution with mean 170 and standard deviation 60The annual demand for Prizdol, a prescription drug manufactured and marketed by the NuFeel Company, is normally distributed with mean 50,000 and standard deviation 12,000. Assume that demand during each of the next 10 years is an independent random number from this distribution. NuFeel needs to determine how large a Prizdol plant to build to maximize its expected profit over the next 10 years. If the company builds a plant that can produce x units of Prizdol per year, it will cost 16 for each of these x units. NuFeel will produce only the amount demanded each year, and each unit of Prizdol produced will sell for 3.70. Each unit of Prizdol produced incurs a variable production cost of 0.20. It costs 0.40 per year to operate a unit of capacity. a. Among the capacity levels of 30,000, 35,000, 40,000, 45,000, 50,000, 55,000, and 60,000 units per year, which level maximizes expected profit? Use simulation to answer this question. b. Using the capacity from your answer to part a, NuFeel can be 95% certain that actual profit for the 10-year period will be between what two values?
- Based on Babich (1992). Suppose that each week each of 300 families buys a gallon of orange juice from company A, B, or C. Let pA denote the probability that a gallon produced by company A is of unsatisfactory quality, and define pB and pC similarly for companies B and C. If the last gallon of juice purchased by a family is satisfactory, the next week they will purchase a gallon of juice from the same company. If the last gallon of juice purchased by a family is not satisfactory, the family will purchase a gallon from a competitor. Consider a week in which A families have purchased juice A, B families have purchased juice B, and C families have purchased juice C. Assume that families that switch brands during a period are allocated to the remaining brands in a manner that is proportional to the current market shares of the other brands. For example, if a customer switches from brand A, there is probability B/(B + C) that he will switch to brand B and probability C/(B + C) that he will switch to brand C. Suppose that the market is currently divided equally: 10,000 families for each of the three brands. a. After a year, what will the market share for each firm be? Assume pA = 0.10, pB = 0.15, and pC = 0.20. (Hint: You will need to use the RISKBINOMLAL function to see how many people switch from A and then use the RISKBENOMIAL function again to see how many switch from A to B and from A to C. However, if your model requires more RISKBINOMIAL functions than the number allowed in the academic version of @RISK, remember that you can instead use the BENOM.INV (or the old CRITBENOM) function to generate binomially distributed random numbers. This takes the form =BINOM.INV (ntrials, psuccess, RAND()).) b. Suppose a 1% increase in market share is worth 10,000 per week to company A. Company A believes that for a cost of 1 million per year it can cut the percentage of unsatisfactory juice cartons in half. Is this worthwhile? (Use the same values of pA, pB, and pC as in part a.)In Problem 11 from the previous section, we stated that the damage amount is normally distributed. Suppose instead that the damage amount is triangularly distributed with parameters 500, 1500, and 7000. That is, the damage in an accident can be as low as 500 or as high as 7000, the most likely value is 1500, and there is definite skewness to the right. (It turns out, as you can verify in @RISK, that the mean of this distribution is 3000, the same as in Problem 11.) Use @RISK to simulate the amount you pay for damage. Run 5000 iterations. Then answer the following questions. In each case, explain how the indicated event would occur. a. What is the probability that you pay a positive amount but less than 750? b. What is the probability that you pay more than 600? c. What is the probability that you pay exactly 1000 (the deductible)?Simulation can be used to illustrate a number of results from statistics that are difficult to understand with nonsimulation arguments. One is the famous central limit theorem, which says that if you sample enough values from any population distribution and then average these values, the resulting average will be approximately normally distributed. Confirm this by using @ RISK with the following population distributions (run a separate simulation for each): (a) discrete with possible values 1 and 2 and probabilities 0.2 and 0.8; (b) exponential with mean 1 (use the RISKEXPON function with the single argument 1); (c) triangular with minimum, most likely, and maximum values equal to 1,9, and 10. (Note that each of these distributions is very skewed.) Run each simulation with 10 values in each average, and run 1000 iterations to simulate 1000 averages. Create a histogram of the averages to see whether it is indeed bell-shaped. Then repeat, using 30 values in each average. Are the histograms based on 10 values qualitatively different from those, based on 30?
- Suppose you have invested 25% of your portfolio in four different stocks. The mean and standard deviation of the annual return on each stock are shown in the file P11_46.xlsx. The correlations between the annual returns on the four stocks are also shown in this file. a. What is the probability that your portfolios annual return will exceed 30%? b. What is the probability that your portfolio will lose money during the year?An automobile manufacturer is considering whether to introduce a new model called the Racer. The profitability of the Racer depends on the following factors: The fixed cost of developing the Racer is triangularly distributed with parameters 3, 4, and 5, all in billions. Year 1 sales are normally distributed with mean 200,000 and standard deviation 50,000. Year 2 sales are normally distributed with mean equal to actual year 1 sales and standard deviation 50,000. Year 3 sales are normally distributed with mean equal to actual year 2 sales and standard deviation 50,000. The selling price in year 1 is 25,000. The year 2 selling price will be 1.05[year 1 price + 50 (% diff1)] where % diff1 is the number of percentage points by which actual year 1 sales differ from expected year 1 sales. The 1.05 factor accounts for inflation. For example, if the year 1 sales figure is 180,000, which is 10 percentage points below the expected year 1 sales, then the year 2 price will be 1.05[25,000 + 50( 10)] = 25,725. Similarly, the year 3 price will be 1.05[year 2 price + 50(% diff2)] where % diff2 is the percentage by which actual year 2 sales differ from expected year 2 sales. The variable cost in year 1 is triangularly distributed with parameters 10,000, 12,000, and 15,000, and it is assumed to increase by 5% each year. Your goal is to estimate the NPV of the new car during its first three years. Assume that the company is able to produce exactly as many cars as it can sell. Also, assume that cash flows are discounted at 10%. Simulate 1000 trials to estimate the mean and standard deviation of the NPV for the first three years of sales. Also, determine an interval such that you are 95% certain that the NPV of the Racer during its first three years of operation will be within this interval.You want to take out a 450,000 loan on a 20-year mortgage with end-of-month payments. The annual rate of interest is 3%. Twenty years from now, you will need to make a 50,000 ending balloon payment. Because you expect your income to increase, you want to structure the loan so at the beginning of each year, your monthly payments increase by 2%. a. Determine the amount of each years monthly payment. You should use a lookup table to look up each years monthly payment and to look up the year based on the month (e.g., month 13 is year 2, etc.). b. Suppose payment each month is to be the same, and there is no balloon payment. Show that the monthly payment you can calculate from your spreadsheet matches the value given by the Excel PMT function PMT(0.03/12,240, 450000,0,0).