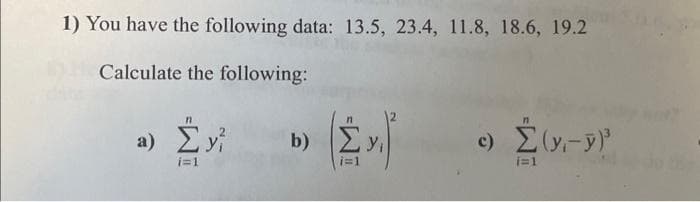
You have the following data: 13.5, 23.4, 11.8, 18.6, 19.2 Calculate the following: a) Σy i=1 b) Συ i=1 © Σ(-1) i=1


Q: Consider the following regression model, y₁ =B₁ + B₁₂x₁₂ + + B₂x + e, 1 2 12 KiK i where E[e₁1x₁]=0…
A: Y1=β1+β2X1i+...+βkXik+ei
Q: 1. An insurance company looks at its auto insurance customers and finds the following: all insure at…
A: All insured at least one car,85% insured more than one car,23% insured a sports car, and17% insured…
Q: A bottling company produces bottles that hold 10 ounces of liquid. Periodically, the company gets…
A: Answer Sample mean = 9.7Population mean =10standard deviation =0.2Sample size =23
Q: (b) Consider an experiment with two factors, where one factor, say, Factor B, is nested within…
A: There is an experiment with 2 factors, Factor B, is nested within Factor A. The task is to state the…
Q: A data set with whole numbers has a low value of 20 and a high value of 89.
A: Lower value=20, High value=89
Q: Researcher A is interested in the wage differential between genders in the Brisbane area. She…
A: Researcher aim : Wage differential between genders in Brisbane area. Sample : ( 4520 full time…
Q: A park ranger is studying the age and health of Black Cherry Trees in his park. Part of his study…
A: 1.By the given histogram, we have the table of frequency distribution as below:ClassFrequency…
Q: John records the number of books that he reads during each month in a given year. The results are in…
A: Number of books 232101242321
Q: Determine whether each of the following situations describes a positive correlation, a negative…
A: It is required to identify the type of correlation between each pair of variables.
Q: • Conducting a post hoc test is similar to conducting multiple t-tests. As a result, it would seem…
A: ANOVA is the generalization of the t-tests. We use the t-tests for checking the significant…
Q: (a) Consider a t distribution with 23 degrees of freedom. Compute P(-1.46 < t <1.46). Round your…
A: It is given as the statement about to the t-distribution.
Q: Frequency distribution is incorrectly constructed. State the reason(s) why they are wrong. Class…
A: Class frequency9-13 114-19 620-25 226-28 529-32 9 We have to tell the mistake in…
Q: The lower and upper specifications a the software upgrades are 78 minutes and 81 minutes. Estimate…
A: Expected process output= [( Total samples - Samples outside the range)/(n)]×100
Q: The military has two different programs for training aircraft personnel. A government regulatory…
A: The sample mean, sample sizes, and population standard deviations are:…
Q: Part (c) 3 Part (b) What percent of students take exactly two courses? X % لیا What percent of…
A: It is given thatThe total of students = 50The number of students who take 3 courses are= 50 - 15 - 5…
Q: =0 A club wants to sponsor a panel discussion on the upcoming national election. The club wants four…
A: Simple random sampling is a statistical method where each member of the population has an exactly…
Q: Find the minimum sample size n needed to estimate u for the given values of c, o, and E. c = 0.90, o…
A: confidence level(c)=0.90standard deviation()=7.4Margin of error(E)=2
Q: Suppose X₁,..., Xn is a random sample from the Gamma distribution Gamma(a, 3), i.e., the density of…
A: A random sample of 100 observations from normal distribution with mean and standard deviation is…
Q: As part of a college literature course, students must select three classic works of literature from…
A: Simple random sampling is a method in statistic that every element of the population being sampled…
Q: 2, 3, 4, 5, 5, 6, 7, 9, 10, 10, 11, 15, 15, 18, 22, 27, 30, 37 Send data to calculator Frequency 8.…
A:
Q: Resting heart rate varies among different people. Design an experiment and examine whether or not a…
A: Student InitialsResting Heart Rate (BPM)Post acitivity Heart RateJames(M)74123Robert (…
Q: Use the following information to answer the next two exercises. The percent of licensed U.S. drivers…
A: The data related to gender and age of licensed drivers are given.
Q: In a random sample of twelve people, the mean driving distance to work was 23.9 miles and the…
A: Sample size, Sample mean, Sample standard deviation, Confidence level,
Q: If the gasket production machine is working properly, the population of gasket OD measures can be…
A: Note=Since you have posted multiple questions, we will provide the solution only to the first…
Q: Seventy-seven percent of the light aircraft that disappear while in flight in a certain country are…
A: Since A part is already answered and mark it correct we will answer (b) part.Given Info: P(A)=0.77…
Q: What are two numbers with the mean of 8 and variance of 4
A: Mean=8, variance=4
Q: ƒ (y; α, µ) = = T(a+y) y! I'(a) 11) #)ª . (1₁- - α a+μ a)³, where y a+μ = 0, 1, 2,....
A: In this problem, we are exploring the distribution defined by the given function .The distribution…
Q: Treatment 3 3454s 5 significanc level. 4 SS nate hypothesis. ins are the same. ns are different.…
A: a) & b)
Q: As the new manager of a small convenience store, you want to understand the shopping 40.39 3.32…
A: Data is given below in ascending…
Q: Create a random chance one-player game with prizes that is fun to play. The game should include all…
A: The expected value for the player must be 0. This value can be adjusted by adjusting the prize or…
Q: Question 12 The distribution of IQ (Intelligence Quotient) is approximately normal in shape with a…
A: Let X: IQ and it follows normal distribution with To determine the respective probabilities…
Q: a random sample of men and women, 15 left-handed males and 8 left-handed females.86 right-handed…
A: Answer Given Men Womenleft-hand…
Q: 1.1-3. Draw one card at random from a standard deck of cards. The sample space S is the collection…
A: Given,Sample space S is the collection of the 52 cards.Total number of clubs in a deck, n(club) =…
Q: To help with its next advertising campaign, a large sporting goods company would like to know which…
A: Given data is: FansPreferences1P2P3P4P5C6P7C8P9P10No Preferences1P12P13No Preferences14P15C16CThe…
Q: One study claimed that 87%87% of college students identify themselves as procrastinators. A…
A: Given:Sample size (n) = 174143 of them identify themselves as procrastinators. The claim is that…
Q: Use the confidence interval to find the estimated margin of error. Then find the sample mean. A…
A: Given that, A biologist reports a confidence interval of (2, 3.2)
Q: identify themselves as procrastinators. Does this evidence support the professor’s claim that fewer…
A: n=118,X=102,p=91%=0.91α=0.01
Q: Hii!! I have a probability problem i´m not sure my procedure is right. 1)You have a deck of 52…
A: A deck consists of playing cards, and all the cards have an equal chance, that is, to appear.To…
Q: Suppose there are 5 students in a room. The mean age is 20.0 years, and the median age is 19. If the…
A: When the observations are 5 the mean and median of the data set areMean = 20.0 years Median= 19…
Q: Which of the following statements is true of Group 1’s mean FIQ score? Group of answer choices: 1.…
A: Please see the results of Post hoc TestThe sample difference between group-1 and group-2's FIQ is…
Q: c. Histograms of Data Set I and Data Set 2 are ow. Whic one has to have the larger standard…
A: We are given histograms for dataset 1 and dataset 2.The objective is to identify the histogram with…
Q: Information about a sample is given. Assume that the sampling distribution is symmetric and…
A:
Q: National ranking of college basketball teams b. Colors of crayons c. Depth of the Pacific…
A: To identify the correct level of measurement for the variables.
Q: anted to study the effect of low light environments on the growth of basil rew five plants and…
A:
Q: Below is a graph of a normal distribution with mean μ-4 and standard deviation o-4. The shaded…
A: Mean()=4standard deviation()=4
Q: d a variety of questionnaires, including one designed to determine their en gave each volunteer an…
A: The explanatory variable in this study is the chronotype, specifically the evening chronotype.2.…
Q: A real estate developer wishes to study the relationship between the size of home a client will…
A: Let Y: the home size(Square feet) is a dependent variable. The independent variables are,X1: family…
Q: Given the data (1,2), (3,6) and (5,14). Use the method of least squares to calculate the estimated…
A: Data : { (1,2) , (3,6) , (5,14) } According to least squares method, We have to calculate regression…
Q: The table below shows the average annual salary Year 1970 1975 1980 1985 1990 1995 2000 2005 040…
A: YearSalary197023197556198079198521719903561995787200011162005140020101900
Q: No written by hand solution and no image A software company is interested in improving customer…
A: Population proportion, Sample size, Number of customers who were satisfied,
Chetan


Trending now
This is a popular solution!

Step by step
Solved in 3 steps with 9 images

- A stamped sheet steel plate is shown in Figure 164. Compute dimensions AF to 3 decimal places. All dimensions are in inches. A=_B=_C=_D=_E=_F=_The article in the ASCE Journal of Energy Engineering (1999, Vol. 125, pp.59-75) describes a study of the thermal inertia properties of autoclaved aerated concrete used as a building material. Five samples of the material were tested in a structure, and the average interior temperatures (°C) reported were as follows: 23.01, 22.22, 22.04, 22.62, and 22.59. Test that the average interior temperature is equal to 22.5°C using alpha (a) = 0.05. This problem is a test on what population parameter? What is the null and alternative hypothesis? What are the Significance level and type of test? What standardized test statistic will be used? What is the standard test statistic? What is the Statistical Decision? What is the statistical decision in the statement form?For a population with u=60 and o=4, the X value corresponding to z=1 would be
- Need help with parts d and k. Data: TSERofReturn AcmeRofReturn 1 0.42478 -0.48194 2 1.61213 -0.73284 3 -0.98754 -2.28445 4 -0.30013 -1.55312 5 1.41215 0.68674 6 0.68725 -1.31132 7 0.03733 -0.83295 8 -1.72494 -1.71975 9 0.33729 1.14443 10 -1.07502 -1.79885 11 0.86222 0.89736 12 1.17468 1.66664 13 -0.38761 -0.02658 14 1.66212 0.9086 15 1.09969 1.99935 16 -0.06266 0.46148 17 -1.96241 -1.41004 18 -1.32499 -0.38086 19 -1.51247 -1.90904 20 0.74974 0.91873 21 -0.38761 -0.49714 22 -0.17514 -1.31385 23 -3.41222 -1.15681 24 -0.01266 2.11718 25 0.16231 1.78766 26 -0.82506 1.30344 27 -0.41261 -0.43377 28 0.2623 -1.70274 29 -1.16251 0.4692 30 -1.05003 0.27671 31 -0.65008 -0.63741 32 0.62475 2.9895 33 -0.68758 1.3613 34…2- An expert estimates that the distribution parameter for durability times of parts produced with machine A in the factory is different from the distribution parameter for durability times of parts produced with machine B. Durability times of 4 parts produced from machine A and 4 parts produced from machine B are given below. Find the Mann-Whitney U value by using these data. a) 18 B) 6 NS) 16 D) 20 TO) 12Let Z~N(0, 1) and X~N(mu, delta2). a. Calculate E[Z4].b. Calculate E[X4].
- Two samples of sizes 60 and 90 have 52 and 48 as the respective A.Ms. and 9 and 12 as the respective S.Ds. Find the A.M and S.D. of the combined sample of size 150.Solve An article in the ASCE Journal of Energy Engineering (1999, Vol. 125, pp.59-75) describes a study of the thermal inertia properties of autoclaved aerated concrete used as a building material. Five samples of the material were tested in a structure, and the average interior temperatures (°C) reported were as follows: 23.01, 22.22, 22.04, 22.62, and 22.59. Test that the average interior temperature is equal to 22.5°C using alpha (a) = 0.05. 1.)This problem is a test on what population parameter? a.Variance/ Standard Deviation b.Mean c.Population Proportion d.None of the above 2.)What is the null and alternative 3 points hypothesis? a.Ho / (theta = 22.5) , Ha: (0 # 22.5) b.Ho / (theta > 22.5) , Ha: (0 # 22.5) c.Ho / (theta < 22.5) , Ha: (theta >= 22.5) d.None of the above 3.)What are the Significance level 3 points and type of test? alpha = 0.05 two-tailed alpha = 0.95 two-tailed alpha = 0.95 one-tailed None of the above 4.)What standardized test statistic will…Consider the following computer output: Test of mu = 90 vs > 90 Variable N Mean StDev SE Mean x 20 91.4 0.717 0.16 What is the value of tcalc? Please report your answer in 3 decimal places.