You have the following data points which belong to a function of the form y = ae , where b can be positive or negative. 29.8 12.0 10.0 2.00 4.00 5.00 You wish to determine the value of the constant, b, and to do so you will construct a linear plot. What will you plot against what? y-axis label: T-axis label: From the values of I and y in the table above, calculate the values of the three corresponding data points. Click on the graph below, and use the "Freeform Curves" tool to plot the data. Line segments will automatically connect the points.
You have the following data points which belong to a function of the form y = ae , where b can be positive or negative. 29.8 12.0 10.0 2.00 4.00 5.00 You wish to determine the value of the constant, b, and to do so you will construct a linear plot. What will you plot against what? y-axis label: T-axis label: From the values of I and y in the table above, calculate the values of the three corresponding data points. Click on the graph below, and use the "Freeform Curves" tool to plot the data. Line segments will automatically connect the points.

Algebra & Trigonometry with Analytic Geometry
13th Edition
ISBN:9781133382119
Author:Swokowski
Publisher:Swokowski
Chapter7: Analytic Trigonometry
Section7.6: The Inverse Trigonometric Functions
Problem 91E

Related questions
Question
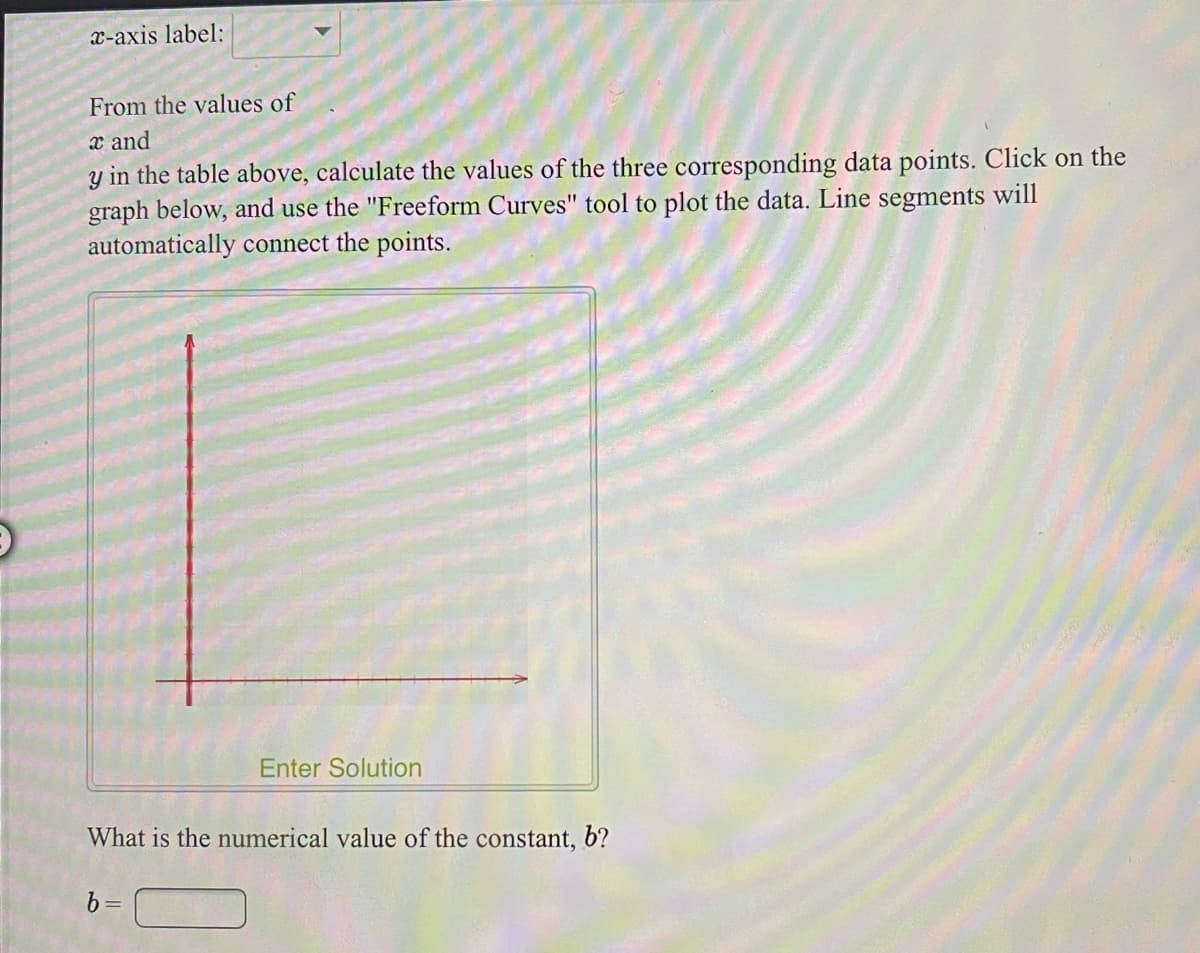
Transcribed Image Text:x-axis label:
From the values of
x and
in the table above, calculate the values of the three corresponding data points. Click on the
graph below, and use the "Freeform Curves" tool to plot the data. Line segments will
automatically connect the points.
Enter Solution
What is the numerical value of the constant, b?
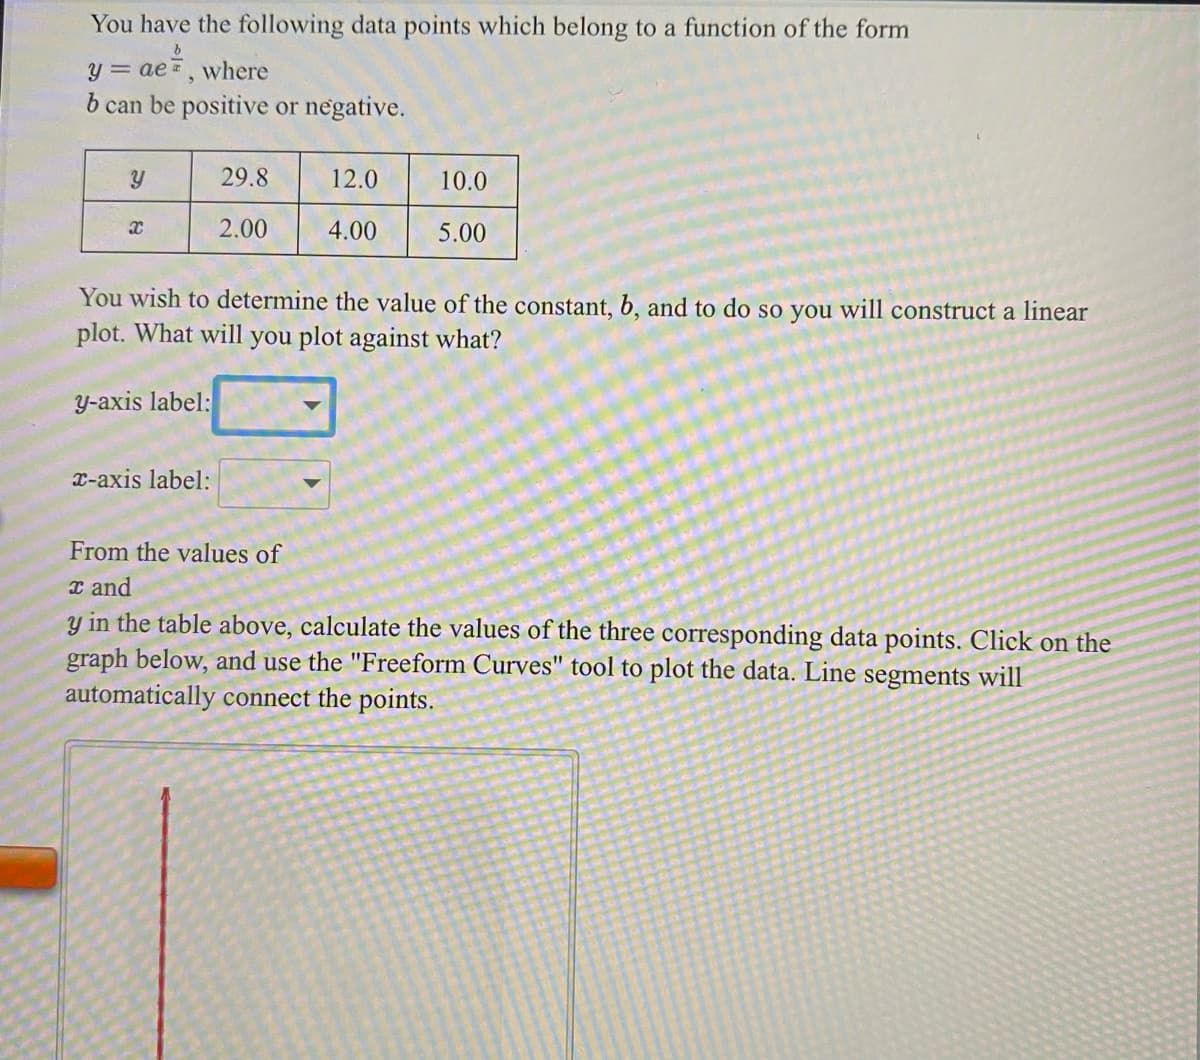
Transcribed Image Text:You have the following data points which belong to a function of the form
y = ae where
b can be positive or negative.
29.8
12.0
10.0
2.00
4.00
5.00
You wish to determine the value of the constant, b, and to do so you will construct a linear
plot. What will you plot against what?
y-axis label:
T-axis label:
From the values of
x and
y in the table above, calculate the values of the three corresponding data points. Click on the
graph below, and use the "Freeform Curves" tool to plot the data. Line segments will
automatically connect the points.
Expert Solution
This question has been solved!
Explore an expertly crafted, step-by-step solution for a thorough understanding of key concepts.

This is a popular solution!

Trending now
This is a popular solution!

Step by step
Solved in 2 steps with 2 images

Recommended textbooks for you
Algebra & Trigonometry with Analytic Geometry
Algebra
ISBN:
9781133382119
Author:
Swokowski
Publisher:
Cengage

Functions and Change: A Modeling Approach to Coll…
Algebra
ISBN:
9781337111348
Author:
Bruce Crauder, Benny Evans, Alan Noell
Publisher:
Cengage Learning

Glencoe Algebra 1, Student Edition, 9780079039897…
Algebra
ISBN:
9780079039897
Author:
Carter
Publisher:
McGraw Hill
Algebra & Trigonometry with Analytic Geometry
Algebra
ISBN:
9781133382119
Author:
Swokowski
Publisher:
Cengage
Functions and Change: A Modeling Approach to Coll…
Algebra
ISBN:
9781337111348
Author:
Bruce Crauder, Benny Evans, Alan Noell
Publisher:
Cengage Learning
Glencoe Algebra 1, Student Edition, 9780079039897…
Algebra
ISBN:
9780079039897
Author:
Carter
Publisher:
McGraw Hill

Algebra and Trigonometry (MindTap Course List)
Algebra
ISBN:
9781305071742
Author:
James Stewart, Lothar Redlin, Saleem Watson
Publisher:
Cengage Learning
