The price X (dollars per pound) and consumption y (in pounds per capita) of beef were samples for 10 randomly selected years. The following data should be used to answer the question that follows. n = 10 Ex = 36.19 Ex2 = 134.17 2.9 < x s 6.2 %3D Ey = 36.19774.74 Ey² = 60739.23 Exy = 2832.21 Before the slope of the line of best fit can be estimated, it is necessary to calculate SSXX. Enter the value for SSxx accurate to the nearest tenth. Xх.
The price X (dollars per pound) and consumption y (in pounds per capita) of beef were samples for 10 randomly selected years. The following data should be used to answer the question that follows. n = 10 Ex = 36.19 Ex2 = 134.17 2.9 < x s 6.2 %3D Ey = 36.19774.74 Ey² = 60739.23 Exy = 2832.21 Before the slope of the line of best fit can be estimated, it is necessary to calculate SSXX. Enter the value for SSxx accurate to the nearest tenth. Xх.

Chapter5: Exponential And Logarithmic Functions
Section5.5: Exponential And Logarithmic Models
Problem 4ECP

Related questions
Question
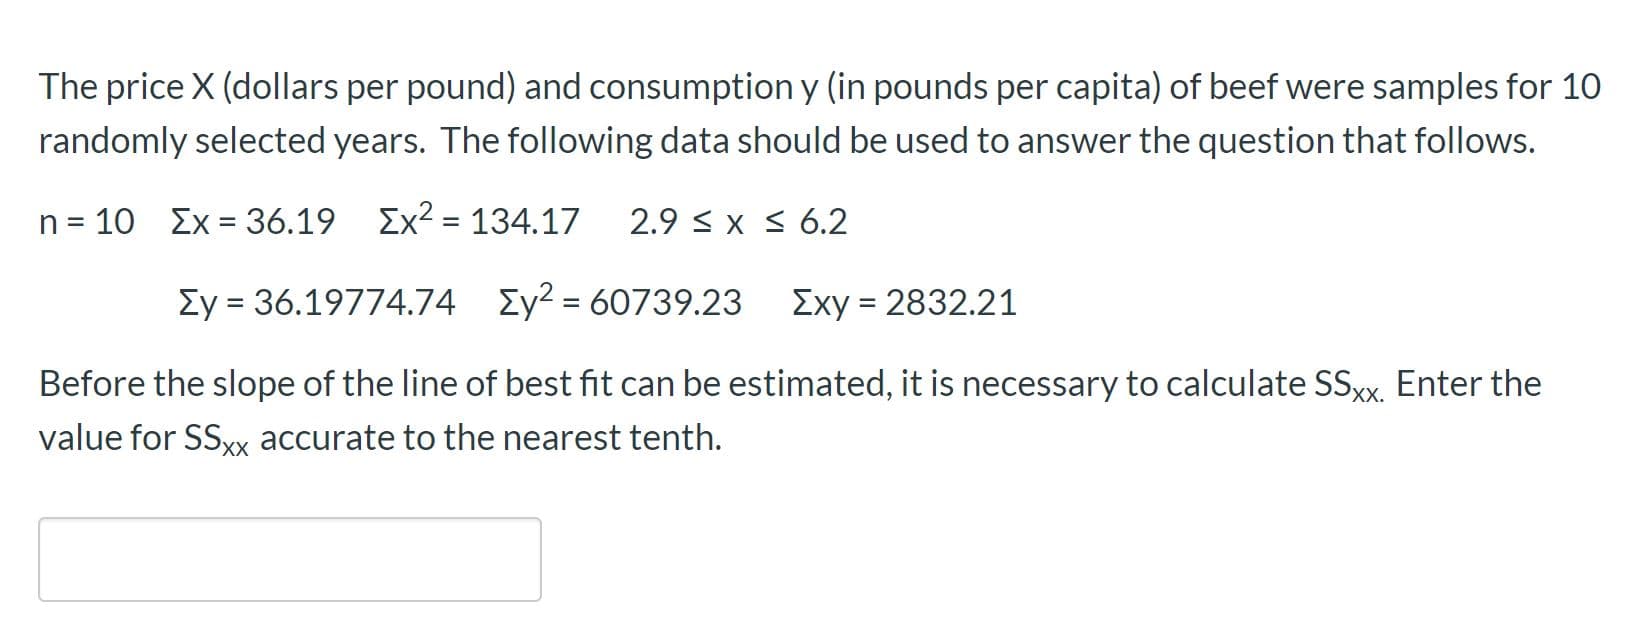
Transcribed Image Text:The price X (dollars per pound) and consumption y (in pounds per capita) of beef were samples for 10
randomly selected years. The following data should be used to answer the question that follows.
n = 10 Ex = 36.19 Ex2 = 134.17
2.9 < x s 6.2
%3D
Ey = 36.19774.74 Ey² = 60739.23
Exy = 2832.21
Before the slope of the line of best fit can be estimated, it is necessary to calculate SSXX. Enter the
value for SSxx accurate to the nearest tenth.
Xх.
Expert Solution
This question has been solved!
Explore an expertly crafted, step-by-step solution for a thorough understanding of key concepts.

This is a popular solution!

Trending now
This is a popular solution!

Step by step
Solved in 2 steps with 2 images

Recommended textbooks for you

Trigonometry (MindTap Course List)
Trigonometry
ISBN:
9781337278461
Author:
Ron Larson
Publisher:
Cengage Learning

Algebra & Trigonometry with Analytic Geometry
Algebra
ISBN:
9781133382119
Author:
Swokowski
Publisher:
Cengage
Trigonometry (MindTap Course List)
Trigonometry
ISBN:
9781337278461
Author:
Ron Larson
Publisher:
Cengage Learning
Algebra & Trigonometry with Analytic Geometry
Algebra
ISBN:
9781133382119
Author:
Swokowski
Publisher:
Cengage


Functions and Change: A Modeling Approach to Coll…
Algebra
ISBN:
9781337111348
Author:
Bruce Crauder, Benny Evans, Alan Noell
Publisher:
Cengage Learning

College Algebra
Algebra
ISBN:
9781305115545
Author:
James Stewart, Lothar Redlin, Saleem Watson
Publisher:
Cengage Learning