You just finished teaching your first PSYCH 248 lab section, and it’s time to calculate the grades. Your wonderful teaching assistant created an Excel file with all of the students’ exam grades, homework grade, and lab grade as well as their gender. Your next steps are to calculate each student’s final grade, convert those scores to letter grades, and describe the distribution of scores. Data Management Steps:
You just finished teaching your first PSYCH 248 lab section, and it’s time to calculate the grades. Your wonderful teaching assistant created an Excel file with all of the students’ exam grades, homework grade, and lab grade as well as their gender. Your next steps are to calculate each student’s final grade, convert those scores to letter grades, and describe the distribution of scores. Data Management Steps:

Algebra: Structure And Method, Book 1
(REV)00th Edition
ISBN:9780395977224
Author:Richard G. Brown, Mary P. Dolciani, Robert H. Sorgenfrey, William L. Cole
Publisher:Richard G. Brown, Mary P. Dolciani, Robert H. Sorgenfrey, William L. Cole
Chapter9: Systems Of Linear Equations
Section9.7: Puzzle Problems
Problem 2OE

Related questions
Question
Background: You just finished teaching your first PSYCH 248 lab section, and it’s time to calculate the grades. Your wonderful teaching assistant created an Excel file with all of the students’ exam grades, homework grade, and lab grade as well as their gender. Your next steps are to calculate each student’s final grade, convert those scores to letter grades, and describe the distribution of scores.
Data Management Steps:
1. Download the CA1_Dataset.csv file from Blackboard.
2. In Excel, calculate the final Number Grade, Letter Grade, and Z-score for each student.
a. To calculate the Number Grade, type a numerical equation after an = sign in a cell or use the =AVERAGE() formula; however, keep in mind that the =AVERAGE() formula will always give you the regular mean, not the weighted mean. Grades for this course are comprised of three parts: lecture exams (60%), homework (20%), and lab (20%).
b. To calculate the Letter Grade, use the =IF() formulawith a series of logic statements or enter the data by hand. For this assignment, let’s convert Number Grade into Letter Grade using the following rubric: A (90-100), B (80-89), C (70-79), D (60-69), F (<60).
c. To calculate the Z-score, use the =STANDARDIZE() formula on the Number Grade variable. This formularequires three components: x (i.e., one student’sNumber Grade), the sample mean, and the sample standard deviation. You can calculate the sample mean and standard deviation for Number Grade using the =AVERAGE() and =STDEV() formulas.
i. Create a new column called Abs(Z-score). In this column, use the =ABS() formula on the Z-score variable you just created to get the absolute values of each Z-score.
3. Now that you have filled in your dataset, save your file and open it in JASP.
a. In the Data View, apply value labels to the Gender variable by clicking on the title of the column and entering the labels accordingly (0=Woman, 1=Man).
b. Make sure that each variable has the correct “column type” (i.e., nominal, ordinal, or scalar).
5. Frequencies
a. How many women were in the class?
b. Paste the frequency table that shows this data below.
6. Percentages
a. What percentage of the class identified as men?
b. How is the Valid Percent column different from the Percent column?
7. Distribution Plots
a. For the Number Grade variable, create a Distribution Plot and apply a density curve. Paste the graph below.
b. Does this plot appear to be fairly normal?
8. Normality/Skewness
a. What is the skewness value for the Number Grade variable?
b. Does this mean the distribution of Number Grades is normal or skewed? Why?
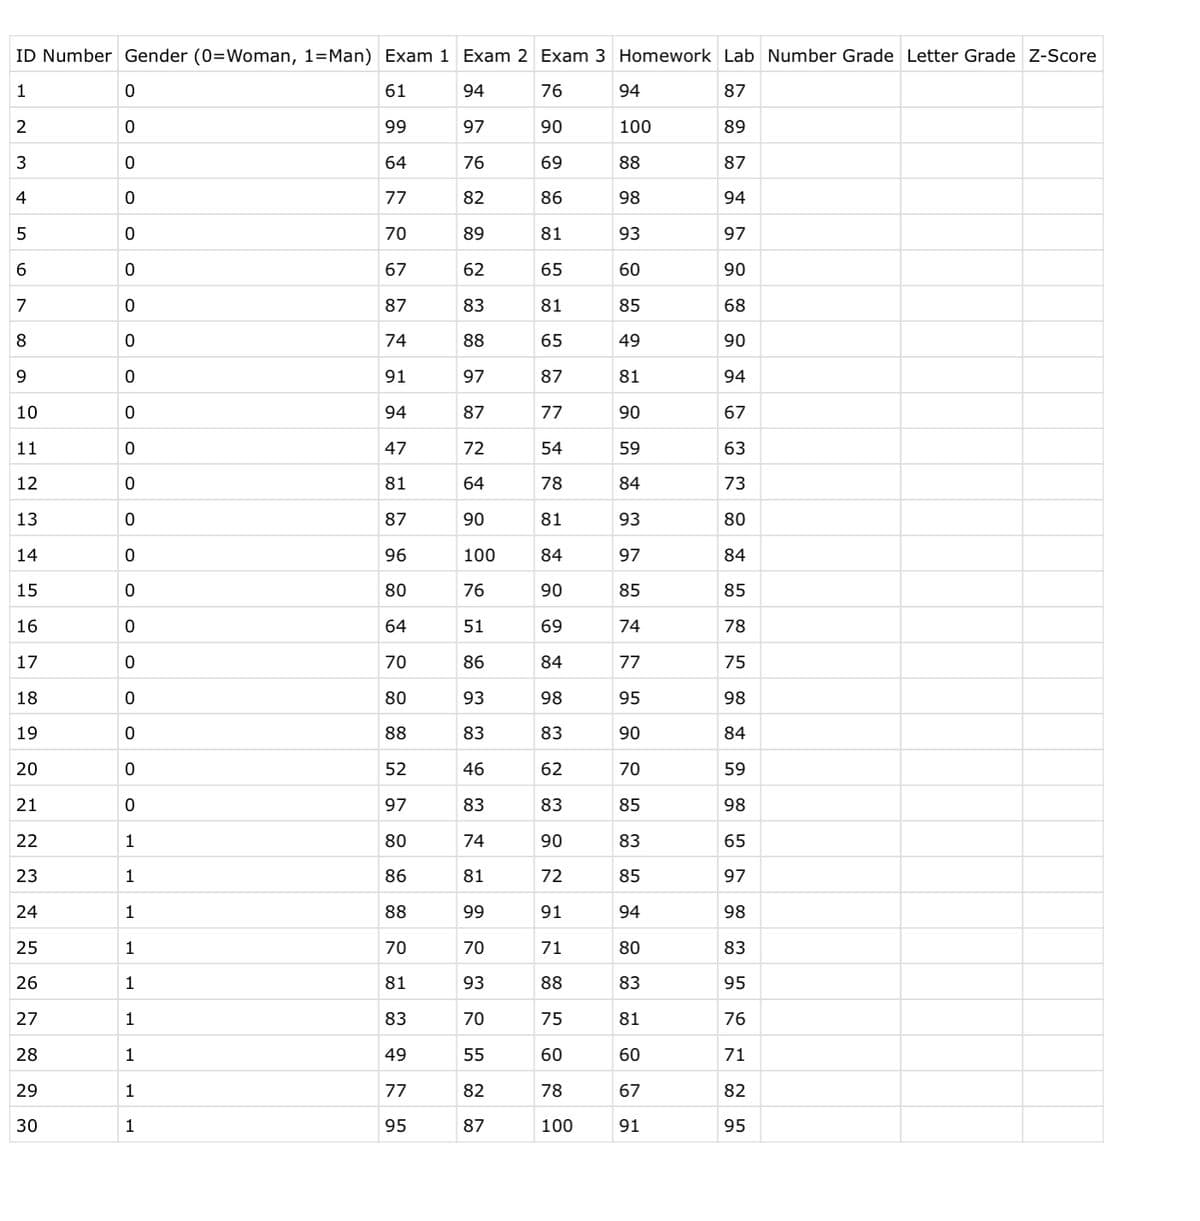
Transcribed Image Text:ID Number Gender (0=Woman, 1=Man) Exam 1 Exam 2 Exam 3 Homework Lab Number Grade Letter Grade Z-Score
1
61
94
76
94
87
2
99
97
90
100
89
3
64
76
69
88
87
4
77
82
86
98
94
70
89
81
93
97
67
62
65
60
90
87
83
81
85
68
8
74
88
65
49
90
91
97
87
81
94
10
94
87
77
90
67
11
47
72
54
59
63
12
81
64
78
84
73
13
87
90
81
93
80
14
96
100
84
97
84
15
80
76
90
85
85
16
64
51
69
74
78
17
70
86
84
77
75
18
80
93
98
95
98
19
88
83
83
90
84
20
52
46
62
70
59
21
97
83
83
85
98
22
1
80
74
90
83
65
23
1
86
81
72
85
97
24
1
88
99
91
94
98
25
1
70
70
71
80
83
26
1
81
93
88
83
95
27
1
83
70
75
81
76
28
1
49
55
60
60
71
29
1
77
82
78
67
82
30
1
95
87
100
91
95
Expert Solution
This question has been solved!
Explore an expertly crafted, step-by-step solution for a thorough understanding of key concepts.

This is a popular solution!

Trending now
This is a popular solution!

Step by step
Solved in 3 steps with 4 images

Recommended textbooks for you
Algebra: Structure And Method, Book 1
Algebra
ISBN:
9780395977224
Author:
Richard G. Brown, Mary P. Dolciani, Robert H. Sorgenfrey, William L. Cole
Publisher:
McDougal Littell

Algebra & Trigonometry with Analytic Geometry
Algebra
ISBN:
9781133382119
Author:
Swokowski
Publisher:
Cengage
Algebra: Structure And Method, Book 1
Algebra
ISBN:
9780395977224
Author:
Richard G. Brown, Mary P. Dolciani, Robert H. Sorgenfrey, William L. Cole
Publisher:
McDougal Littell
Algebra & Trigonometry with Analytic Geometry
Algebra
ISBN:
9781133382119
Author:
Swokowski
Publisher:
Cengage