You make a phospholipid bilayer with short, unsaturated hydrocarbon tails. You measure the permeability of this membrane to oxygen and water, which are normally somewhat able to cross the membrane. You then saturate the hydrocarbon tails, and re-measure membrane permeability. You then double the length of the saturated hydrocarbon tails again, and make a third measurement of membrane permeability. You graph membrane permeability (Y) as a function of hydrocarbon tail length (X). Which of the graphs below best represents the data you expect? O Graph 1 O Graph 2 O Graph 3 y O Graph 4 y X X ^
You make a phospholipid bilayer with short, unsaturated hydrocarbon tails. You measure the permeability of this membrane to oxygen and water, which are normally somewhat able to cross the membrane. You then saturate the hydrocarbon tails, and re-measure membrane permeability. You then double the length of the saturated hydrocarbon tails again, and make a third measurement of membrane permeability. You graph membrane permeability (Y) as a function of hydrocarbon tail length (X). Which of the graphs below best represents the data you expect? O Graph 1 O Graph 2 O Graph 3 y O Graph 4 y X X ^

Concepts of Biology
1st Edition
ISBN:9781938168116
Author:Samantha Fowler, Rebecca Roush, James Wise
Publisher:Samantha Fowler, Rebecca Roush, James Wise
Chapter3: Cell Structure And Function
Section: Chapter Questions
Problem 11RQ: The tails of the phospholipids of the plasma membrane are composed of _____ and are _____? a....

Related questions

Question
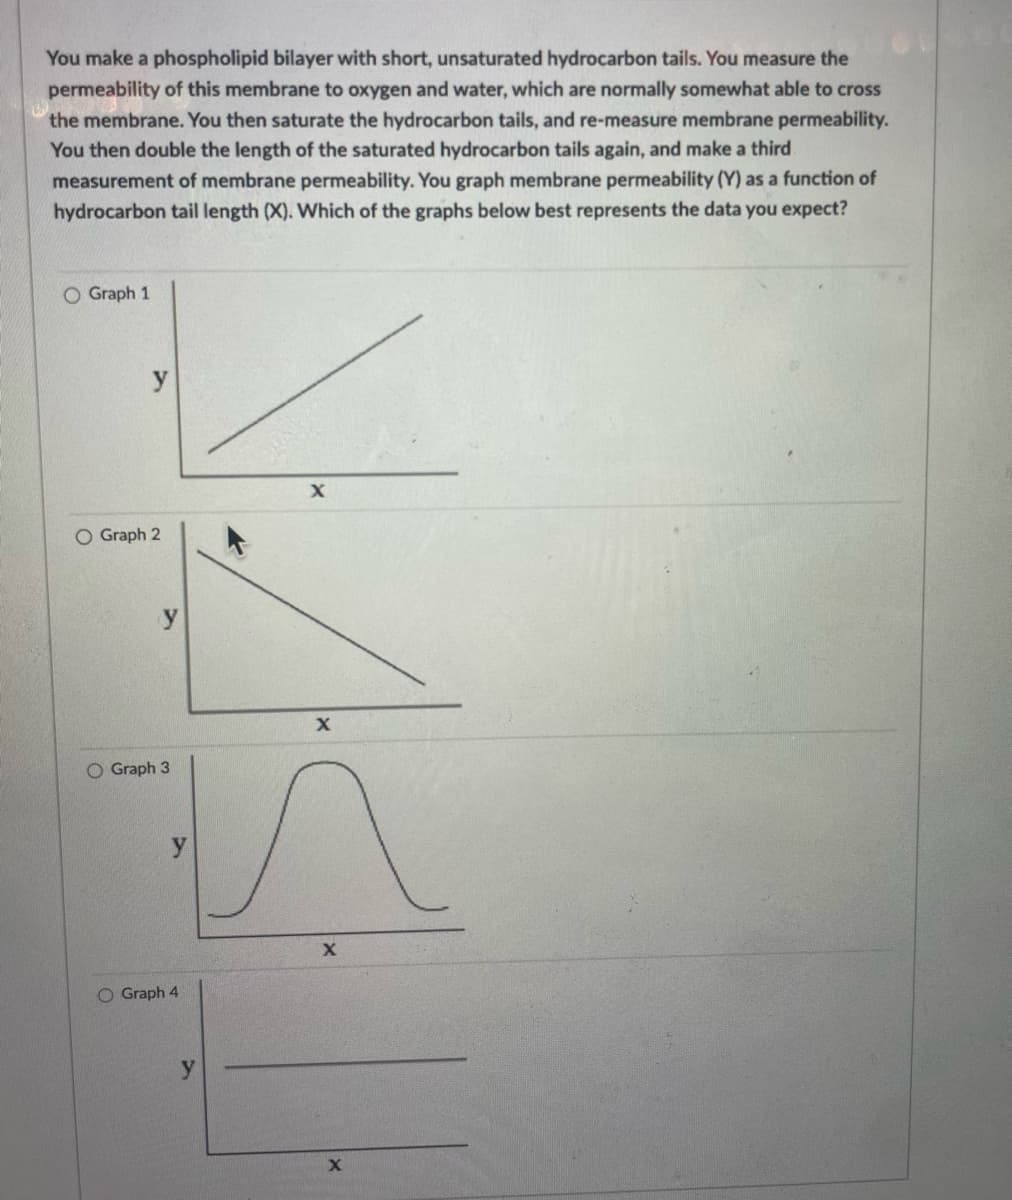
Transcribed Image Text:You make a phospholipid bilayer with short, unsaturated hydrocarbon tails. You measure the
permeability of this membrane to oxygen and water, which are normally somewhat able to cross
the membrane. You then saturate the hydrocarbon tails, and re-measure membrane permeability.
You then double the length of the saturated hydrocarbon tails again, and make a third
measurement of membrane permeability. You graph membrane permeability (Y) as a function of
hydrocarbon tail length (X). Which of the graphs below best represents the data you expect?
O Graph 1
O Graph 2
O Graph 3
y
O Graph 4
y
X
X
^
X
X
Expert Solution
This question has been solved!
Explore an expertly crafted, step-by-step solution for a thorough understanding of key concepts.

This is a popular solution!

Trending now
This is a popular solution!

Step by step
Solved in 4 steps

Knowledge Booster


Learn more about
Need a deep-dive on the concept behind this application? Look no further. Learn more about this topic, biology and related others by exploring similar questions and additional content below.Recommended textbooks for you
Concepts of Biology
Biology
ISBN:
9781938168116
Author:
Samantha Fowler, Rebecca Roush, James Wise
Publisher:
OpenStax College

Concepts of Biology
Biology
ISBN:
9781938168116
Author:
Samantha Fowler, Rebecca Roush, James Wise
Publisher:
OpenStax College