You receive a brochure from a large university. The brochure indicates that the mean class size for full-time faculty is fewer than 31 students. You want to test t claim. You randomly select 18 classes taught by full-time faculty and determine the class size of each. The results are shown in the table below. At a = 0.10, ca support the university's claim? Complete parts (a) through (d) below. Assume the population is normally distributed.
You receive a brochure from a large university. The brochure indicates that the mean class size for full-time faculty is fewer than 31 students. You want to test t claim. You randomly select 18 classes taught by full-time faculty and determine the class size of each. The results are shown in the table below. At a = 0.10, ca support the university's claim? Complete parts (a) through (d) below. Assume the population is normally distributed.

Mathematics For Machine Technology
8th Edition
ISBN:9781337798310
Author:Peterson, John.
Publisher:Peterson, John.
Chapter29: Tolerance, Clearance, And Interference
Section: Chapter Questions
Problem 16A: Spacers are manufactured to the mean dimension and tolerance shown in Figure 29-12. An inspector...

Related questions
Topic Video
Question
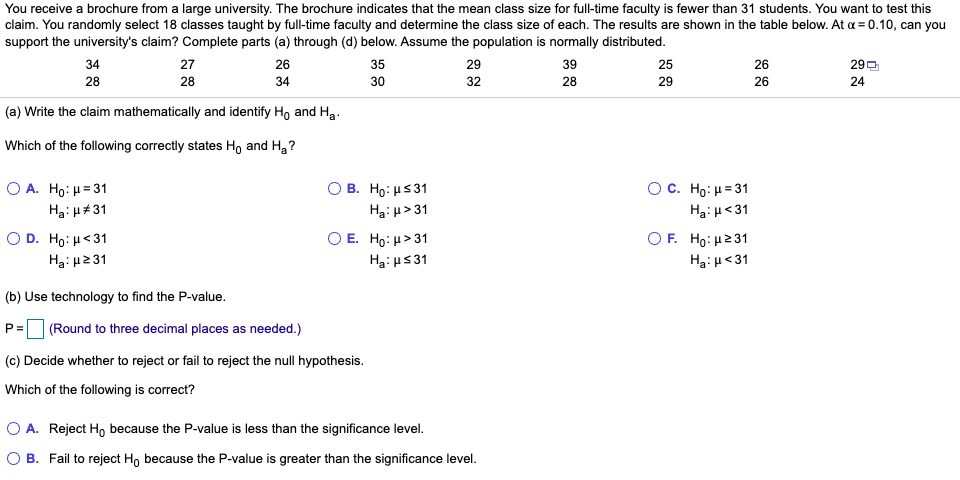
Transcribed Image Text:You receive a brochure from a large university. The brochure indicates that the mean class size for full-time faculty is fewer than 31 students. You want to test this
claim. You randomly select 18 classes taught by full-time faculty and determine the class size of each. The results are shown in the table below. At a = 0.10, can you
support the university's claim? Complete parts (a) through (d) below. Assume the population is normally distributed.
34
27
26
35
29
39
25
26
290
28
28
34
30
32
28
29
26
24
(a) Write the claim mathematically and identify Ho and Ha.
Which of the following correctly states Ho and H3?
O A. Ho: H= 31
B. Ho, μs 31
O c. Ho : μ= 3
Ha: H#31
Ha: u> 31
Ha: H<31
O D. Ho: H<31
O E. Ho: H>31
OF. Ho: H231
Ha: u231
Ha: us 31
Ha: µ<31
(b) Use technology to find the P-value.
P =
(Round to three decimal places as needed.)
(c) Decide whether to reject or fail to reject the null hypothesis.
Which of the following is correct?
O A. Reject Ho because the P-value is less than the significance level.
O B. Fail to reject H, because the P-value is greater than the significance level.
Expert Solution
This question has been solved!
Explore an expertly crafted, step-by-step solution for a thorough understanding of key concepts.

Step by step
Solved in 3 steps with 1 images

Knowledge Booster


Learn more about
Need a deep-dive on the concept behind this application? Look no further. Learn more about this topic, statistics and related others by exploring similar questions and additional content below.Recommended textbooks for you
Mathematics For Machine Technology
Advanced Math
ISBN:
9781337798310
Author:
Peterson, John.
Publisher:
Cengage Learning,

Glencoe Algebra 1, Student Edition, 9780079039897…
Algebra
ISBN:
9780079039897
Author:
Carter
Publisher:
McGraw Hill
Mathematics For Machine Technology
Advanced Math
ISBN:
9781337798310
Author:
Peterson, John.
Publisher:
Cengage Learning,
Glencoe Algebra 1, Student Edition, 9780079039897…
Algebra
ISBN:
9780079039897
Author:
Carter
Publisher:
McGraw Hill