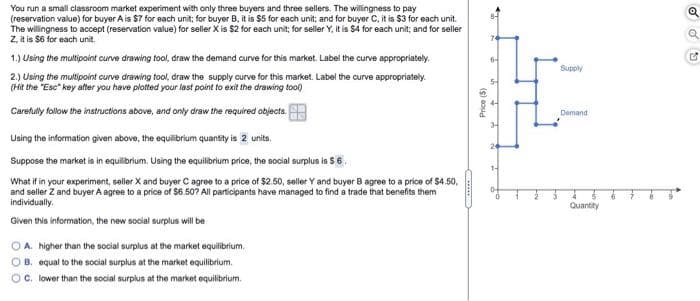
You run a small classroom market experiment with only three buyers and three sellers. The willingness to pay (reservation value) for buyer A is $7 for each unit; for buyer B, it is $5 for each unit; and for buyer C, it is $3 for each unit. The willingness to accept (reservation value) for seller X is $2 for each unit; for seller Y, it is $4 for each unit; and for seller Z, it is $6 for each unit. 1.) Using the multipoint curve drawing tool, draw the demand curve for this market. Label the curve appropriately. 2.) Using the multipoint curve drawing tool, draw the supply curve for this market. Label the curve appropriately. (Hit the "Esc" key after you have plotted your last point to exit the drawing tool) Carefully follow the instructions above, and only draw the required objects. Using the information given above, the equilibrium quantity is 2 units. Suppose the market is in equilibrium. Using the equilibrium price, the social surplus is $ 6. What if in your experiment, seller X and buyer C agree to a price of $2.50, seller Y and buyer B agree to a price of $4.50, and seller 2 and buyer A agree to a price of $6.50? All participants have managed to find a trade that benefits them individually. Given this information, the new social surplus will be OA. higher than the social surplus at the market equilibrium. B. equal to the social surplus at the market equilibrium. C. lower than the social surplus at the market equilibrium. Price ($) 24 Supply Demand Quantity
You run a small classroom market experiment with only three buyers and three sellers. The willingness to pay (reservation value) for buyer A is $7 for each unit; for buyer B, it is $5 for each unit; and for buyer C, it is $3 for each unit. The willingness to accept (reservation value) for seller X is $2 for each unit; for seller Y, it is $4 for each unit; and for seller Z, it is $6 for each unit. 1.) Using the multipoint curve drawing tool, draw the demand curve for this market. Label the curve appropriately. 2.) Using the multipoint curve drawing tool, draw the supply curve for this market. Label the curve appropriately. (Hit the "Esc" key after you have plotted your last point to exit the drawing tool) Carefully follow the instructions above, and only draw the required objects. Using the information given above, the equilibrium quantity is 2 units. Suppose the market is in equilibrium. Using the equilibrium price, the social surplus is $ 6. What if in your experiment, seller X and buyer C agree to a price of $2.50, seller Y and buyer B agree to a price of $4.50, and seller 2 and buyer A agree to a price of $6.50? All participants have managed to find a trade that benefits them individually. Given this information, the new social surplus will be OA. higher than the social surplus at the market equilibrium. B. equal to the social surplus at the market equilibrium. C. lower than the social surplus at the market equilibrium. Price ($) 24 Supply Demand Quantity

Microeconomics A Contemporary Intro
10th Edition
ISBN:9781285635101
Author:MCEACHERN
Publisher:MCEACHERN
Chapter8: An Introduction To Perfect Competition
Section: Chapter Questions
Problem 9QFR

Related questions
Question
Ab 15
Economics
last question
Transcribed Image Text:You run a small classroom market experiment with only three buyers and three sellers. The willingness to pay
(reservation value) for buyer A is $7 for each unit; for buyer B, it is $5 for each unit; and for buyer C, it is $3 for each unit.
The willingness to accept (reservation value) for seller X is $2 for each unit; for seller Y, it is $4 for each unit; and for seller
Z, it is $6 for each unit.
1.) Using the multipoint curve drawing tool, draw the demand curve for this market. Label the curve appropriately.
2.) Using the multipoint curve drawing tool, draw the supply curve for this market. Label the curve appropriately.
(Hit the "Esc" key after you have plotted your last point to exit the drawing tool)
Carefully follow the instructions above, and only draw the required objects.
Using the information given above, the equilibrium quantity is 2 units.
Suppose the market is in equilibrium. Using the equilibrium price, the social surplus is $6
What if in your experiment, seller X and buyer C agree to a price of $2.50, seller Y and buyer B agree to a price of $4.50,
and seller Z and buyer A agree to a price of $6.50? All participants have managed to find a trade that benefits them
individually.
Given this information, the new social surplus will be
OA. higher than the social surplus at the market equilibrium.
B. equal to the social surplus at the market equilibrium.
C. lower than the social surplus at the market equilibrium.
Price ($)
I
4
NA
to
Supply
Demand
Quantity
✓ ✓ U
Expert Solution
This question has been solved!
Explore an expertly crafted, step-by-step solution for a thorough understanding of key concepts.

This is a popular solution!

Trending now
This is a popular solution!

Step by step
Solved in 3 steps

Knowledge Booster


Learn more about
Need a deep-dive on the concept behind this application? Look no further. Learn more about this topic, economics and related others by exploring similar questions and additional content below.Recommended textbooks for you

Managerial Economics: A Problem Solving Approach
Economics
ISBN:
9781337106665
Author:
Luke M. Froeb, Brian T. McCann, Michael R. Ward, Mike Shor
Publisher:
Cengage Learning
Managerial Economics: A Problem Solving Approach
Economics
ISBN:
9781337106665
Author:
Luke M. Froeb, Brian T. McCann, Michael R. Ward, Mike Shor
Publisher:
Cengage Learning