You want to determine if diet impacts body weight. You recruit 40 subjects who undergo a dietary intervention. You measure body weight before, in the middle of, and after the intervention. To determine the time (pre vs. mid vs. post) effect on body weight, you would use a Assume all assumptions are met for a parametric test. O Factorial ANOVA One-way repeated measures ANOVA Factorial repeated measures ANOVA One-way ANOVA
You want to determine if diet impacts body weight. You recruit 40 subjects who undergo a dietary intervention. You measure body weight before, in the middle of, and after the intervention. To determine the time (pre vs. mid vs. post) effect on body weight, you would use a Assume all assumptions are met for a parametric test. O Factorial ANOVA One-way repeated measures ANOVA Factorial repeated measures ANOVA One-way ANOVA

College Algebra
7th Edition
ISBN:9781305115545
Author:James Stewart, Lothar Redlin, Saleem Watson
Publisher:James Stewart, Lothar Redlin, Saleem Watson
Chapter1: Equations And Graphs
Section: Chapter Questions
Problem 8P: Noise and Intelligibility Audiologists study the intelligibility of spoken sentences under different...

Related questions
Question
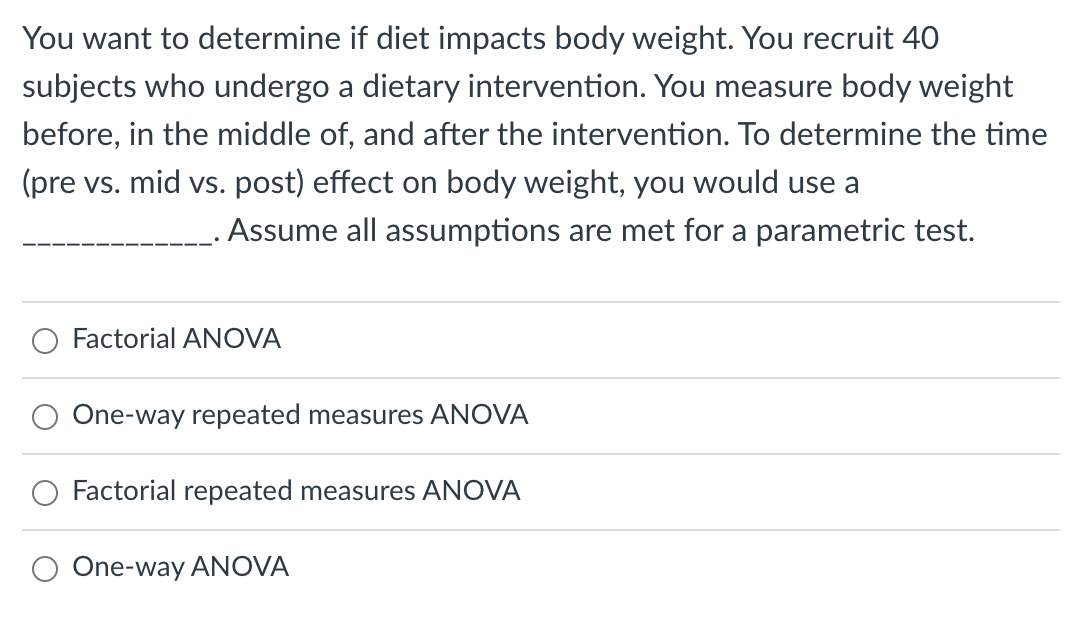
Transcribed Image Text:You want to determine if diet impacts body weight. You recruit 40
subjects who undergo a dietary intervention. You measure body weight
before, in the middle of, and after the intervention. To determine the time
(pre vs. mid vs. post) effect on body weight, you would use a
Assume all assumptions are met for a parametric test.
O Factorial ANOVA
One-way repeated measures ANOVA
Factorial repeated measures ANOVA
One-way ANOVA
Expert Solution
This question has been solved!
Explore an expertly crafted, step-by-step solution for a thorough understanding of key concepts.

Step by step
Solved in 2 steps

Recommended textbooks for you
College Algebra
Algebra
ISBN:
9781305115545
Author:
James Stewart, Lothar Redlin, Saleem Watson
Publisher:
Cengage Learning

Algebra & Trigonometry with Analytic Geometry
Algebra
ISBN:
9781133382119
Author:
Swokowski
Publisher:
Cengage

Algebra and Trigonometry (MindTap Course List)
Algebra
ISBN:
9781305071742
Author:
James Stewart, Lothar Redlin, Saleem Watson
Publisher:
Cengage Learning
College Algebra
Algebra
ISBN:
9781305115545
Author:
James Stewart, Lothar Redlin, Saleem Watson
Publisher:
Cengage Learning
Algebra & Trigonometry with Analytic Geometry
Algebra
ISBN:
9781133382119
Author:
Swokowski
Publisher:
Cengage
Algebra and Trigonometry (MindTap Course List)
Algebra
ISBN:
9781305071742
Author:
James Stewart, Lothar Redlin, Saleem Watson
Publisher:
Cengage Learning

Functions and Change: A Modeling Approach to Coll…
Algebra
ISBN:
9781337111348
Author:
Bruce Crauder, Benny Evans, Alan Noell
Publisher:
Cengage Learning

Linear Algebra: A Modern Introduction
Algebra
ISBN:
9781285463247
Author:
David Poole
Publisher:
Cengage Learning

Big Ideas Math A Bridge To Success Algebra 1: Stu…
Algebra
ISBN:
9781680331141
Author:
HOUGHTON MIFFLIN HARCOURT
Publisher:
Houghton Mifflin Harcourt