You wish to estimate, with 95% confidence, the population proportion of U.S. adults who want more funding for alternative energy. Your estimate must be accurate within 4% of the population proportion. a) No preliminary estimate is available. Find the minimum sample size needed. b) Find the minimum sample size needed, using a prior study that found that 78% of U.S adults want more funding for alternative energy. c) Compare the results from parts (a) and (b).
Q: (10 points) The following data contains days when road rage occurred according to a study. The goal…
A:
Q: Do bonds reduce the overall risk of an investment portfolio? Let x be a random variable representing…
A: Given data: x 19 0 13 33 18 11 31 -20 -12 -16 y 17 -10 9 27 17 8 25 -3 -2 -3
Q: (a) Consider a t distribution with 13 degrees of freedom. Compute P(-1.33 <1<1.33). Round your…
A: Givena)Degrees of freedom(df)=13P(-1.33<t<1.33)
Q: s). What is the shape of the distribution of the collected data?
A: The variable under consideration is reaction time. Given that, Mean = 6 Median = 14 Mode = 5 Discuss…
Q: 5. b. Let the marginal savings from pollution generation be given by MS and marginal damages be…
A: This question evaluates whether emission fees and emissions targets will produce the same amount of…
Q: Hi I was looking to see how to work it out without the excel function, I liked to see how to find…
A: Given data : Mean = u = 510 SD = o = 20
Q: NASA is conducting an experiment to find out the fraction of people who black out at G forces…
A: We have given information, Let x= number of people passed out at G forces greater than 6. A sample…
Q: X; 0 2 5 The empirical distribution of some variable X is given by the following table. (x, are…
A:
Q: 6. In the continuous-time limit from the binomial model, find m and a for u = 0.4, d= -0.3 and 7 =…
A: This question seeks to find the expected return, μ, and the volatility, σ, of a binomial model in…
Q: A die is specially built so that the even numbers are twice as likely as the odd numbers. A test is…
A: The observed occurrence of the faces is given as: Face 1 2 3 4 5 6 Freq. 23 36 22 44 18 37…
Q: (iv) The mean level of Mn in fruit juice samples (n = 5) detected by Mn absorbance at 279.5 nm was…
A: Given Information: The mean level of Mn in fruit juice detected by Mn absorbance at 279.5 nm was…
Q: Let p be the population proportion for the following condition. Find the point estimates for p and…
A: given data sample size (n) = 1992no. of favorable outcomes (x) = 577we have to find point estimate…
Q: A machine is designed to fill 16-ounce bottles of shampoo. When the machine is working properly, the…
A: Answer:- Given, sample size n = 4 , sample mean x = 16.05 The population…
Q: 3. Long or short? Put the names of all the students in your statistics class in a hat. Mix them up,…
A: The question is about distribution Given : No. of names drawn without looking ( n ) = 4 Y = No. of…
Q: Records of randomly selected births were obtained and categorized according to the day of the week…
A: Given that We have to test hypothesis for the claim that births occur on the different days with…
Q: 2. A certain manufacturing plant has five workers who are assigned to work in the assembly area. The…
A: To estimate the percent idle time, we need to calculate the ratio of idle time observations to the…
Q: If only 7 of the 12 spins land in the blue region, do we have convincing evidence that the website’s…
A: Given that, The spinners have two colored regions blue and yellow. P(blue) = prob. of success (p) =…
Q: 11. A college student population of freshman and seniors was surveyed to determine if they prefer…
A: Given that: PA1=0.40PA2=0.60PB|A1=0.60PB|A2=0.20
Q: The data in the accompanying table represent the heights and weights of a random sample of…
A: The data table provided in the question is as follows : Height Weight 75 227 75 195 72 180…
Q: A study of 420,008 cell phone users found that 0.0310% of them developed cancer of the brain or…
A: given data sample size (n) = 420008p^ =0.000310 95% ci p= ?
Q: Assume that when adults with smartphones are randomly selected 57% use them in meetings or classes…
A: The given sample size is 7 and probability of randomly selected adult use smartphones in meetings or…
Q: If there is no significant correlation between the response and explanatory variables, would the…
A:
Q: For a confidence level of 99% with a sample size of 30, find the critical t value.
A: given data n = 30 99% ci for mean critical t value = ?
Q: (a) Develop an estimated regression equation that can be used to predict Delay by using Industry and…
A: The regression equation for Delay can be calculated using the following code in R: Which gives the…
Q: An airline developed a regression model to predict revenue from flights that connect "feeder" cities…
A: The question is about regression Given : Reg. eq. : Est. revenue = 81 + 0.30Distance + 1.4Population…
Q: 53. Assemblers at a job-shop are required to submit materials requisition forms in person to a store…
A: Let λ be the rate parameter of the exponential distribution representing the time between materials…
Q: A survey of 225 randomly chosen commuters are asked if they support an expanded public…
A:
Q: 4. Sketch a dot plot for the variable Height. Describe the data distribution. 59 60 60 61 61 61 62…
A: Given data : 59 60 60 61 61 61 62 62 63 63 63 63 63 64 65 65 65 66 66 67
Q: The table to the right contains observed values and expected values in parentheses for two…
A: Introduction The chi-square test is a non-parametric test.
Q: Out of 600 people sampled, 480 had kids. Based on this, construct a 95% confidence interval for the…
A: given that , out of 600 people sampled, 480 had kids.
Q: A researcher wanted to determine if carpeted or uncarpeted rooms contain more bacteria. The table…
A: Given Information: Carpeted Uncarpeted 9.6 12.2 9.9 10 9.1 9 9.5 10.8 8.9 10.1 8.9…
Q: Assume that females have pulse rates that are normally distributed with a mean of u = 75.0 beats per…
A: Suppose the random variable x defines the pulse rate of females.
Q: A confidence interval for a sample is given, followed by several hypotheses to test using that…
A: The 90% confidence interval for p1 - p2 is given by (0.04, 0.19)
Q: A researcher conducted an independent samples t-test, and found a Cohen's d effect size of .80.…
A: We have given information, A researcher conducted an independent sample t-test. Cohen's d effect…
Q: In a survey of 2263 adults, 733 say they believe in UFOs. Construct a 90% confidence interval for…
A: We have to find confidence interval for population proportion (p) Formula : CI = p^± zα/2p^(1-p^)n…
Q: Turn 3:27:81:18 into simple form
A: The given information is: 3:27:81:18.
Q: Assume the readings on thermometers are normally distributed with a mean of 0°C and a standard…
A: given data, μ=0σ=1.00 we have to find out the given probabilities.
Q: Based on anecdotal observations, they hypothesized that residents of the county tended to prefer…
A: Given Hypothesis is an assumption that is being tested.
Q: A fitted regression for an exam class showed Score = 20 + 7 Study, where Score is the student's…
A: Given Information: The fitted regression equation is Score = 20 + 7 Study. where Score is the…
Q: As part of a water quality survey, you test the water hardness in several randomly selected streams.…
A: given data sample size(n) = 23 sample standard deviation(s) = 12construct 90 % ci for σ and σ2.
Q: Consider a dice showing i with probability pi > 0 where i = 1, . . . , 6. The entropy of the…
A: This question deals with finding the probability distribution which minimizes the entropy of a dice…
Q: Create a two-way table for the variables Eye Color and Organ Donors. What percentage of organ donors…
A: Given: Eye-color Organ Donors Hz N Bro Y Bro Y Blu N Hz N Bro Y Bro N Bro N…
Q: e president of Doerman Distributors, Inc., believes that 28% of the firm's orders come from…
A: given data, p=0.28n=100we have to find out the given probabilities
Q: Assume that a randomly selected subject is given a bone density test. Those test scores are normally…
A: Introduction The normal distribution is symmetric and it has a bell shaped curve.
Q: at a university, 60% of the 7400 students are female. the student newspaper reports results of a…
A: given data N = 7400p = 0.60n = 200P(0.50<p^ <0.60) = ?
Q: A genetic experiment with peas resulted in one sample of offspring that consisted of 444 green peas…
A: Given that, The number of green peas is 444 The number of yellow peas 155. The sample proportion is…
Q: IV: levels of stress DV: self rated anxiety low stress high stress 1…
A: Introduction SPSS is a statistical software that helps in analyzing the data using statistical…
Q: Hits 2500 2000 1500 1000 500 A. True Ⓒ31 Mar B. False Monday Tuesday Wednesday Thursday o 9Apr o…
A: Here the given box plot is and the statement is Less than 25 percent of Thursdays had a higher…
Q: You want to estimate the mean pH level of the water in a nearby river. You randomly select 19 water…
A: Given that: Sample size, n=19 Sample mean, x¯=6.7 Sample standard deviation, s=0.24 Confidence level…
Q: Exercise 13. Let X₁, X₂₁~ N(H₂,o2) i.i.d. and Y₁,...,Y~N(₂, ²) i.i.d. with known o². We assume that…
A: Given Xi~N(μx,σ2) ,Yi~N(uy,σ2)Corr(XiYi)=12D=Xi-Yi Show Cov(XiYi)=σ22 Determine E(D) and Var(D)…
Please answer the following question using ****EXCEL****
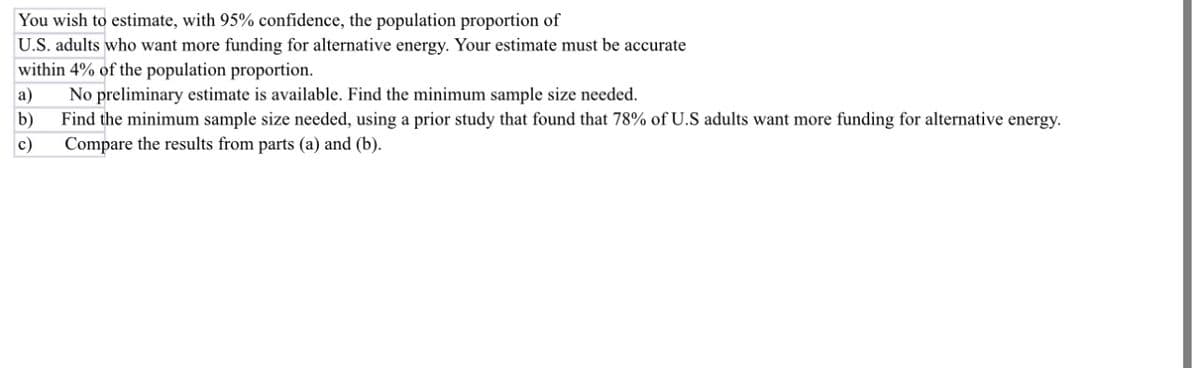
Step by step
Solved in 5 steps with 7 images
- When estimating the minimum sample size required for a research, if we do not have the preliminary estimate of proportion we consider p equal toPlease view the question in the photo and answer the following questions. TY! (A) What is the minimum sample size needed assuming that no prior information is available? (B) What is the minimum sample size needed using a prior study that found that 36% of the respondents said they think Congress is doing a good or excellent job?A researcher wishes to estimate, with 90% confidence, the population proportion of likely U.S. voters who think Congress is doing a good or excellent job. Her estimate must be accurate within 1% of the true proportion. (a) No preliminary estimate is available. Find the minimum sample size needed. (b) Find the minimum sample size needed, using a prior study that found that 18% of the respondents said they think Congress is doing a good or excellent job. (c) Compare the results from parts (a) and (b).
- A researcher wishes to estimate, with 90%onfidence, the population proportion of adults who think Congress is doing a good or excellent job. Her estimate must be accurate within 4% of the true proportion.(a) No preliminary estimate is available. Find the minimum sample size needed. (b) Find the minimum sample size needed, using a prior study that found that 32% of the respondents said they think Congress is doing a good or excellent job. (c) Compare the results from parts (a) and (b).A researcher wishes to estimate, with 90% confidence, the population proportion of adults who think Congress is doing a good or excellent job. Her estimate must be accurate within 22% of the true proportion. (a) No preliminary estimate is available. Find the minimum sample size needed. (b) Find the minimum sample size needed, using a prior study that found that 42%of the respondents said they think Congress is doing a good or excellent job. (c) Compare the results from parts (a) and (b).Find the minimum sample size you should use to assure that your estimate of p will be within the required margin of error around the population p.
- A researcher wishes to estimate, with 90%confidence, the population proportion of adults who think Congress is doing a good or excellent job. Her estimate must be accurate within 4% of the true proportion. (a) No preliminary estimate is available. Find the minimum sample size needed. (b) Find the minimum sample size needed, using a prior study that found that 44% of the respondents said they think Congress is doing a good or excellent job. (c) Compare the results from parts (a) and (b).Estimate the sample size needed if no estimate of p is available. PART B(a) What is the minimum sample size needed assuming that no prior information is available? (b) What is the minimum sample size needed using a prior study that found that 32% of the respondents said they think Congress is doing a good or excellent job? (c) How do the results from (a) and (b) compare? A. Having an estimate of the population proportion reduces the minimum sample size needed. B. Having an estimate of the population proportion has no effect on the minimum sample size needed. C. Having an estimate of the population proportion raises the minimum sample size needed.
- Use the given data to find the minimum sample size required to estimate the population proportion.(b) If the sample size was increased to 10,000 American movie-goers, what effect would this have on the estimated percentage of American movie-goers who think the popcorn is overpriced?Part 2 Estimate the sample size needed if no estimate of p is available.