You wish to test the following claim (H) at a significance level of a = 0.05. Ho: P₁ = P2 Ha: P₁ P2 You obtain 18.6% successes in a sample of size n₁ = 280 from the first population. You obta 14.2% successes in a sample of size n₂ = 465 from the second population. For this test, you should NOT use the continuity correction, and you should use the normal distribution as an approximation for the binomial distribution. What is the test statistic for this sample? (Report answer accurate to three decimal places.) test statistic = 1.593 x
You wish to test the following claim (H) at a significance level of a = 0.05. Ho: P₁ = P2 Ha: P₁ P2 You obtain 18.6% successes in a sample of size n₁ = 280 from the first population. You obta 14.2% successes in a sample of size n₂ = 465 from the second population. For this test, you should NOT use the continuity correction, and you should use the normal distribution as an approximation for the binomial distribution. What is the test statistic for this sample? (Report answer accurate to three decimal places.) test statistic = 1.593 x

Glencoe Algebra 1, Student Edition, 9780079039897, 0079039898, 2018
18th Edition
ISBN:9780079039897
Author:Carter
Publisher:Carter
Chapter10: Statistics
Section10.1: Measures Of Center
Problem 9PPS

Related questions
Question
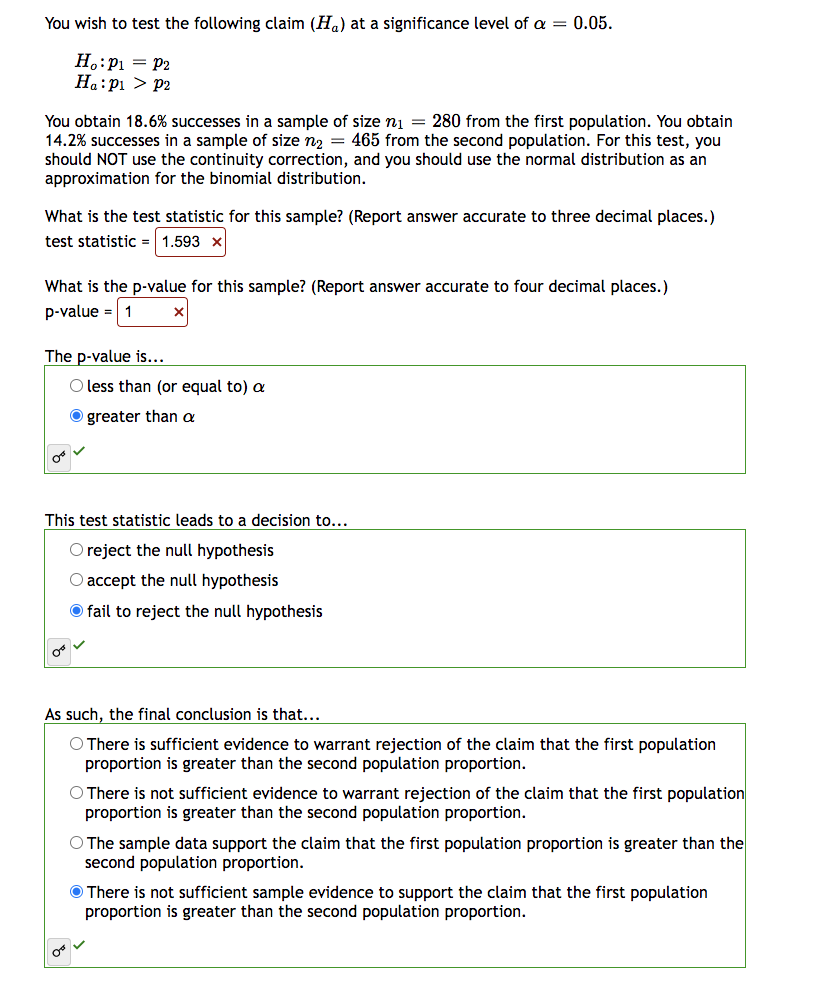
Transcribed Image Text:You wish to test the following claim (H₁) at a significance level of a = 0.05.
Ho: P₁ = P2
Ha:pı > P2
You obtain 18.6% successes in a sample of size n₁ = 280 from the first population. You obtain
14.2% successes in a sample of size n₂ = 465 from the second population. For this test, you
should NOT use the continuity correction, and you should use the normal distribution as an
approximation for the binomial distribution.
What is the test statistic for this sample? (Report answer accurate to three decimal places.)
test statistic = 1.593
What is the p-value for this sample? (Report answer accurate to four decimal places.)
p-value = 1
The p-value is...
X
O less than (or equal to) a
Ogreater than a
✓
This test statistic leads to a decision to...
O reject the null hypothesis
O accept the null hypothesis
fail to reject the null hypothesis
As such, the final conclusion is that...
O There is sufficient evidence to warrant rejection of the claim that the first population
proportion is greater than the second population proportion.
O There is not sufficient evidence to warrant rejection of the claim that the first population
proportion is greater than the second population proportion.
O The sample data support the claim that the first population proportion is greater than the
second population proportion.
There is not sufficient sample evidence to support the claim that the first population
proportion is greater than the second population proportion.
Expert Solution
This question has been solved!
Explore an expertly crafted, step-by-step solution for a thorough understanding of key concepts.

This is a popular solution!

Trending now
This is a popular solution!

Step by step
Solved in 2 steps

Recommended textbooks for you
Glencoe Algebra 1, Student Edition, 9780079039897…
Algebra
ISBN:
9780079039897
Author:
Carter
Publisher:
McGraw Hill
Glencoe Algebra 1, Student Edition, 9780079039897…
Algebra
ISBN:
9780079039897
Author:
Carter
Publisher:
McGraw Hill