Your answer is partially correct. Try again. The customers at a bank complained about long lines and the time they had to spend waiting for service. It is known that the customers at this bank had to wait 9 minutes, on average, before being served. The management made some changes to reduce the waiting time for its customers. A sample of 59 customers taken after these changes were made produced a mean waiting time of 8.1 minutes with a standard deviation of 2.5 minutes. Using this sample mean, the bank manager displayed a huge banner inside the bank mentioning that the mean waiting time for customers has been reduced by new changes. Do you think the bank manager's claim is justifiable? Use a 2.5% significance level to answer this question. Use both approaches. Use the p-value approach. Use the t distribution table to find a range for the p-value. Enter the exact values for the range. 0.8895 0.8895 < p-value Use the critical-value approach. Round your answers to three decimal places. -2.765 Observed value 0.8895 Critical value = true Conclusion: The manager's claim is
Your answer is partially correct. Try again. The customers at a bank complained about long lines and the time they had to spend waiting for service. It is known that the customers at this bank had to wait 9 minutes, on average, before being served. The management made some changes to reduce the waiting time for its customers. A sample of 59 customers taken after these changes were made produced a mean waiting time of 8.1 minutes with a standard deviation of 2.5 minutes. Using this sample mean, the bank manager displayed a huge banner inside the bank mentioning that the mean waiting time for customers has been reduced by new changes. Do you think the bank manager's claim is justifiable? Use a 2.5% significance level to answer this question. Use both approaches. Use the p-value approach. Use the t distribution table to find a range for the p-value. Enter the exact values for the range. 0.8895 0.8895 < p-value Use the critical-value approach. Round your answers to three decimal places. -2.765 Observed value 0.8895 Critical value = true Conclusion: The manager's claim is

Glencoe Algebra 1, Student Edition, 9780079039897, 0079039898, 2018
18th Edition
ISBN:9780079039897
Author:Carter
Publisher:Carter
Chapter10: Statistics
Section10.4: Distributions Of Data
Problem 19PFA

Related questions

Concept explainers
Contingency Table
A contingency table can be defined as the visual representation of the relationship between two or more categorical variables that can be evaluated and registered. It is a categorical version of the scatterplot, which is used to investigate the linear relationship between two variables. A contingency table is indeed a type of frequency distribution table that displays two variables at the same time.
Binomial Distribution
Binomial is an algebraic expression of the sum or the difference of two terms. Before knowing about binomial distribution, we must know about the binomial theorem.
Topic Video
Question
can i have the answers marked in red
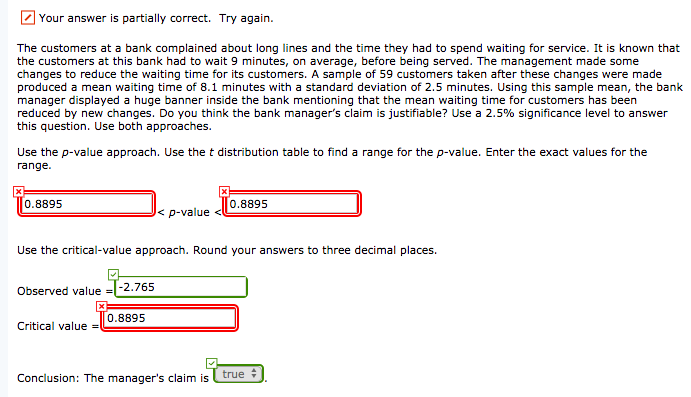
Transcribed Image Text:Your answer is partially correct. Try again.
The customers at a bank complained about long lines and the time they had to spend waiting for service. It is known that
the customers at this bank had to wait 9 minutes, on average, before being served. The management made some
changes to reduce the waiting time for its customers. A sample of 59 customers taken after these changes were made
produced a mean waiting time of 8.1 minutes with a standard deviation of 2.5 minutes. Using this sample mean, the bank
manager displayed a huge banner inside the bank mentioning that the mean waiting time for customers has been
reduced by new changes. Do you think the bank manager's claim is justifiable? Use a 2.5% significance level to answer
this question. Use both approaches.
Use the p-value approach. Use the t distribution table to find a range for the p-value. Enter the exact values for the
range.
0.8895
0.8895
< p-value
Use the critical-value approach. Round your answers to three decimal places.
-2.765
Observed value
0.8895
Critical value =
true
Conclusion: The manager's claim is
Expert Solution
This question has been solved!
Explore an expertly crafted, step-by-step solution for a thorough understanding of key concepts.

This is a popular solution!

Trending now
This is a popular solution!

Step by step
Solved in 2 steps

Knowledge Booster


Learn more about
Need a deep-dive on the concept behind this application? Look no further. Learn more about this topic, statistics and related others by exploring similar questions and additional content below.Recommended textbooks for you
Glencoe Algebra 1, Student Edition, 9780079039897…
Algebra
ISBN:
9780079039897
Author:
Carter
Publisher:
McGraw Hill
Glencoe Algebra 1, Student Edition, 9780079039897…
Algebra
ISBN:
9780079039897
Author:
Carter
Publisher:
McGraw Hill