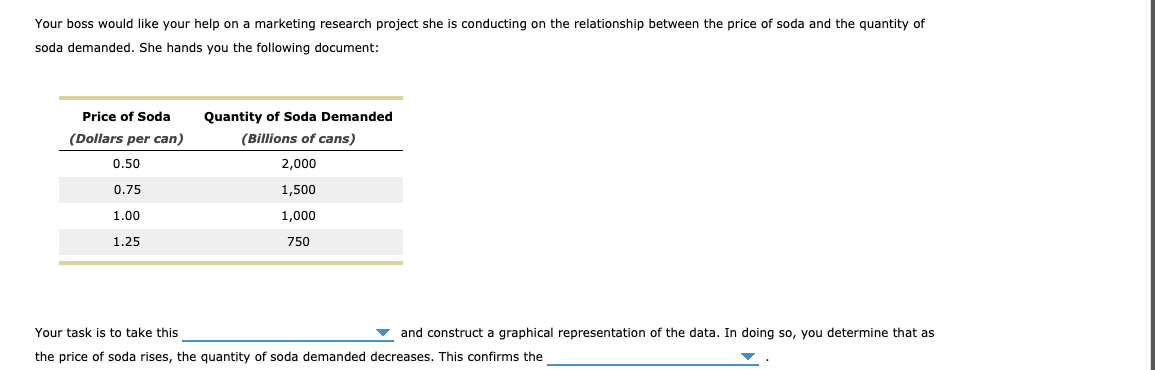
Your boss would like your help on a marketing research project she is conducting on the relationship between the price of soda and the quantity of soda demanded. She hands you the following document: Price of Soda Quantity of Soda Demanded (Dollars per can) (Billions of cans) 0.50 2,000 0.75 1,500 1.00 1,000 1.25 750 Your task is to take this and construct a graphical representation of the data. In doing so, you determine that as the price of soda rises, the quantity of soda demanded decreases. This confirms the
Your boss would like your help on a marketing research project she is conducting on the relationship between the price of soda and the quantity of soda demanded. She hands you the following document: Price of Soda Quantity of Soda Demanded (Dollars per can) (Billions of cans) 0.50 2,000 0.75 1,500 1.00 1,000 1.25 750 Your task is to take this and construct a graphical representation of the data. In doing so, you determine that as the price of soda rises, the quantity of soda demanded decreases. This confirms the

Chapter1: Introducing The Economic Way Of Thinking
Section1.A: Applying Graphs To Economics
Problem 2SQP

Related questions
Question
Transcribed Image Text:Your boss would like your help on a marketing research project she is conducting on the relationship between the price of soda and the quantity of
soda demanded. She hands you the following document:
Price of Soda
Quantity of Soda Demanded
(Dollars per can)
(Billions of cans)
0.50
2,000
0.75
1,500
1.00
1,000
1.25
750
Your task is to take this
and construct a graphical representation of the data. In doing so, you determine that as
the price of soda rises, the quantity of soda demanded decreases. This confirms the
Expert Solution
This question has been solved!
Explore an expertly crafted, step-by-step solution for a thorough understanding of key concepts.

This is a popular solution!

Trending now
This is a popular solution!

Step by step
Solved in 2 steps with 1 images

Recommended textbooks for you


Macroeconomics: Principles and Policy (MindTap Co…
Economics
ISBN:
9781305280601
Author:
William J. Baumol, Alan S. Blinder
Publisher:
Cengage Learning
