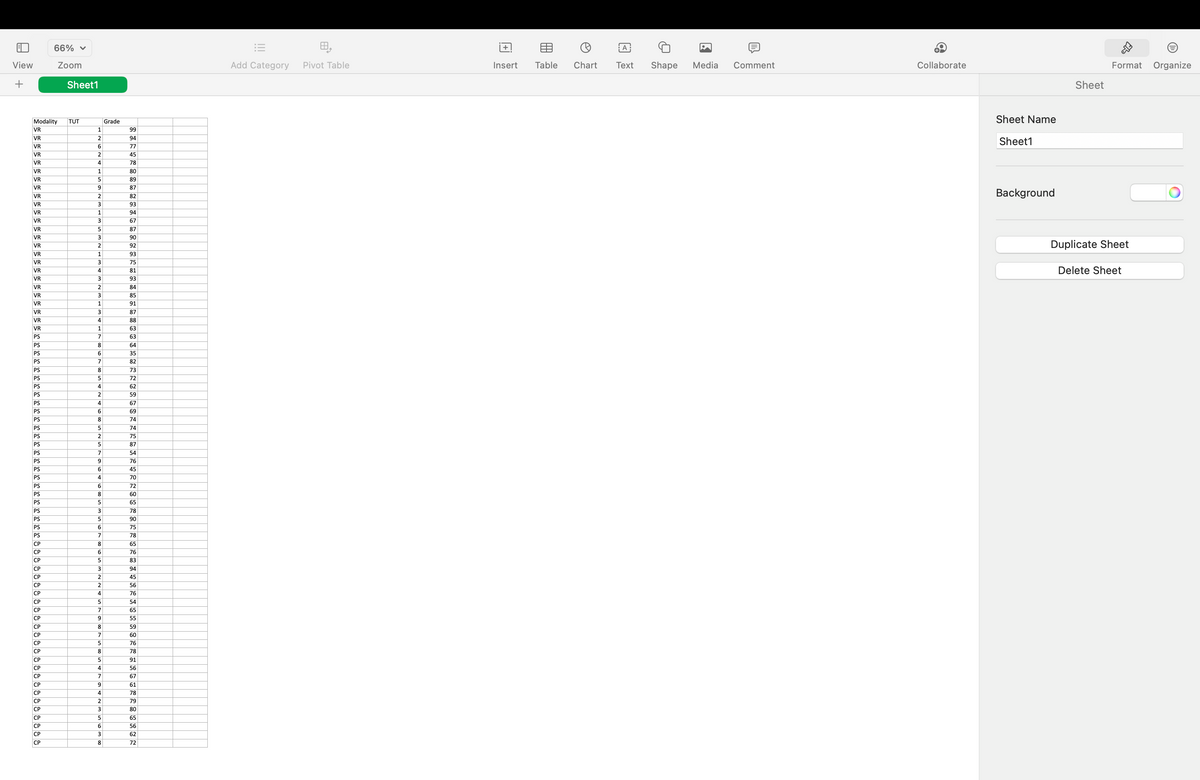
Your team members conducted a study where they had participants watch a lecture video in either (a) virtual reality (VR), (b) large projector screen (PS), or (c) a computer screen (CP). They are interested in whether immersion, such as that experienced when in a learning while wearing a virtual reality helmet, increases students’ grades and decreases mind wandering in class. At one point in the middle of the lecture, participants were interrupted to answer a question about their thoughts. They answered the question, “were you thinking about something other than the lecture?” on a scale from 1 (not at all) to 9 (extremely). This question measures what psychologists call “task-unrelated thought” (TUT) and it’s a common measure of mind wandering pertaining to learning because it assesses whether students are experiencing thoughts that are off-topic and unrelated to the task at hand (i.e., listening to a lecture). At the end of the lecture, participants completed a brief quiz to measure their retention of the information from class, which was graded on a typical scale. Your team has two research questions for this dataset that are paired together: 1) Does immersion compared to two other common learning modalities decrease TUT? 2) Does immersion compared to two other common learning modalities increase students’ grades on quizzes? How many levels are there for your independent variable(s)? You will need to run two different analyses to answer each research question. What type of statistical analysis do you need to use for each and why? Write your null and alternative hypotheses for each research question. Before running your analyses, check all your assumptions for the tests you need to run and explain whether you met each of those assumptions. (Include screenshots.) Run your analyses and post-hoc tests (if needed). (Include screenshots.) Conceptually, what do each set of analyses mean for both of your research questions? How does your independent variable impact your dependent variables? (Use non-statistical language.) Conceptually, put the results of both of your studies toget


Your team members conducted a study where they had participants watch a lecture video in either (a) virtual reality (VR), (b) large projector screen (PS), or (c) a computer screen (CP). They are interested in whether immersion, such as that experienced when in a learning while wearing a virtual reality helmet, increases students’ grades and decreases mind wandering in class. At one point in the middle of the lecture, participants were interrupted to answer a question about their thoughts. They answered the question, “were you thinking about something other than the lecture?” on a scale from 1 (not at all) to 9 (extremely). This question measures what psychologists call “task-unrelated thought” (TUT) and it’s a common measure of mind wandering pertaining to learning because it assesses whether students are experiencing thoughts that are off-topic and unrelated to the task at hand (i.e., listening to a lecture). At the end of the lecture, participants completed a brief quiz to measure their retention of the information from class, which was graded on a typical scale. Your team has two research questions for this dataset that are paired together: 1) Does immersion compared to two other common learning modalities decrease TUT? 2) Does immersion compared to two other common learning modalities increase students’ grades on quizzes?
-
- How many levels are there for your independent variable(s)?
- You will need to run two different analyses to answer each research question. What type of statistical analysis do you need to use for each and why?
- Write your null and alternative hypotheses for each research question.
- Before running your analyses, check all your assumptions for the tests you need to run and explain whether you met each of those assumptions. (Include screenshots.)
- Run your analyses and post-hoc tests (if needed). (Include screenshots.)
- Conceptually, what do each set of analyses mean for both of your research questions? How does your independent variable impact your dependent variables? (Use non-statistical language.)
- Conceptually, put the results of both of your studies together because the independent variable is the same. In a few sentences, explain how the results from your each of your studies go hand in hand.
- As a statistician, what are your recommendations for the education company you work for to start producing programs based on your data for what aids student learning best?


Trending now
This is a popular solution!

Step by step
Solved in 3 steps

Run your analyses and post-hoc tests (if needed). (Include screenshots.)
-
- Conceptually, what do each set of analyses mean for both of your research questions? How does your independent variable impact your dependent variables? (Use non-statistical language.)
- Conceptually, put the results of both of your studies together because the independent variable is the same. In a few sentences, explain how the results from your each of your studies go hand in hand.
- As a statistician, what are your recommendations for the education company you work for to start producing programs based on your data for what aids student learning best?

