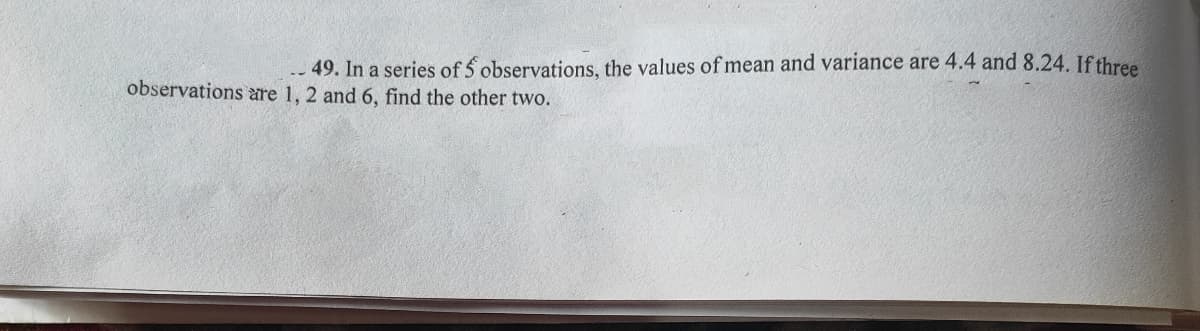
.49. In a series of 5 observations, the values of mean and variance are 4.4 and 8.24. If three observations are 1, 2 and 6, find the other two.
Q: 1) which of the following is the formula for range? H + L L x H L – H HL 2) consider the following…
A: 1) Formula for range: The formula for range is given as follows: Range=Highest value-Lowest value…
Q: 1. The mean of 5 observations is 15 and the variance is 9. If two more observations having values -…
A: As per guidelines we are allowed to solve maximum of 1 question. If you need help with other…
Q: n = 11 Ex=55 Ex²=2230 Give the value of the sample standard deviation.
A:
Q: The following values represent the daily wages of a sample of workers, the sample mean is OMR 30. 27…
A:
Q: If the correlation coefficient between variables is .60, how much of the variance is unexplained by…
A:
Q: If other factors are held constant, which of the following sets of data is most likely to produce a…
A: If other factors are held constant, the set of data which have highest sample size decreases the…
Q: 9 25. The mean and standard deviation of a set of 100 observations were worked out as 40 and 5…
A:
Q: The following C.I.s were obtained for the mean of the same populat [16, 23] and [18, 25]. Identify…
A: From the given information, The C.I for the mean are 16, 23 and 18, 25. Consider, [16, 23].…
Q: What are the values for SS and variance for the following sample of n = 4 scores? Scores: 1, 3, 0, 4…
A: Given sampleof n = 4 scores Scores: 1, 3, 0, 4
Q: Now, suppose that the agronomist is also interested in how a particular type of fertilizer, in…
A: (d). Identify the experimental units in the study: The agronomist is interested to test how a…
Q: in a sample of n=6 five of the scores are above the mean by one point. where is the sixth score…
A: Let x be the mean, y be the sixth score and 5 scores are one point above the mean is 5(x+1).
Q: A set of 10 scores has SS = 90. If the scores are a sample, the sample variance is and if the scores…
A: Given: Number of scores (n) = 10 Sample variance:
Q: A student obtained the mean and SD of 100 observations as 40 and 5.1 respectively. It was later…
A: The Variance formula of ungrouped data set is given by Variance σ2=∑xi-x2n…
Q: The mean deviation of the data(1 * :2,9,9,3,6,9,4 from the mean is 2.23 3.23 O 2.57 O 3.57 O
A:
Q: 9. Which of the following plots indicate a sample correlation coefficient close to 0? A. First plot…
A: If there is no correlation then the value of the correlation coefficient is 0.
Q: For the following set of scores: 6, 2, 3, 0, 4 a. If the scores are a population, what are the vari-…
A: The variance and standard deviation (square root of variance) are the most commonly used measures of…
Q: Consider the following observations: 2, 0, 5, 3, 5, 3. The mean of these data is
A: The mean is defined as the sum of observations divided by number of observations.
Q: For the following set of scores: 1,4,3,5,7 a.) if the scores are a population, what are the variance…
A:
Q: 4. Compute coefficient of quartile deviation from the following data : Marks 10 20 30 40 No. of…
A:
Q: Suppose the test scores of 600 students are normally distributed with a mean of 76 and standard…
A:
Q: A student was asked to compute the mean and standard deviation for the following sample of n 5…
A:
Q: For which of the following is the mean greater than the median?
A: Among these graphs , no (e) is a negatively skewed distribution and according to the property of the…
Q: The coefficient of variance of the (4 following set of data (18,20,15,12,25.) *is 20
A:
Q: 1. The following questions refer to the following data: 2, -1, 0, 2. What is the sample mean of the…
A:
Q: What is the value of the Pearson coefficient of skewness for a distribution with a mean of 27,…
A:
Q: Compute the population variance of the data: 16,18,23,21,17,16,24,23,9,17,11,16,22,10,15,14. A.…
A: σ2= ∑(xi-x¯)2n
Q: For the following set of scores: 1, 4, 3, 5, 7 (a) if the scores are a population, what are the…
A: From given scores, the sum of scores and sum of squares of scores can be calculated as: If scores…
Q: (a) The mean and S.D of a set of 100 observations were worked out as 40 and 5 respectively. But by…
A:
Q: 5. Suppose there are 10,000 test takers of the IQ test where the mean is 100 and the standard…
A: I solved exactly first question because of bartleby policy if you want more please upload…
Q: I Find the variance of the given data rounded to the nearest hundredth. 5.6, 5.2, 4.6, 4.9, 5.7, 6.4…
A: topic -variance of data mean=sum of elements in data/number of elememts
Q: which of the following groups of scores exhibits the least variability? A. 2,4,6,8,10,12 B.…
A: Enter the data in excel as shown below:
Q: -of the data in a distribution is within 3 standa the mean? 66% 0% 50% 89%
A: Solution : According to the Chebyshev's theorem, (1-1/k^2) of the observation fall within k standard…
Q: T'he mean and standard deviation of a set of 100 observations were worked out as 40 and 5…
A:
Q: with M = 85 and s = 12 is transformed into z-scores. After the transformation, what are the values…
A: According to the sum, A sample with M = 85 and s = 12 is transformed into z-scores. M=sample mean=85…
Q: (1) The mean and variance of y, are, respectively,
A: by bartleby policy i can give only one question at time. so ,sorry for 2nd question
Q: Four of your classmates measured the diagonal length of the blackboard. Classmate A measured it as…
A:
Q: Which of the following statements is true for the following data values: 7 5, 6, 4, 7,8 and 12? O…
A:
Q: From the community hospital and clinics around a city, the ages of dentists, nurses and physicians…
A:
Q: Answer each of the following: The distribution of sample means for students taking the SAT exam has…
A: Given that the distribution of sample means (M) for students taking the SAT exam has a population…
Q: For the following set of scores: 6, 2, 3, 0, 4 If the scores are a population, what are the vari-…
A:
Q: The Variance of Population for the following data :X = 155, 175, 125, 155, 175, 195, 185, 525, 255,…
A:
Q: Suppose that the score in Mathematics exam is normally distributed with a mean of 20 and a standard…
A:
Q: Which of the following samples will produce the largest value for a t statistic? Solect one: a. D =…
A: We have to identify true option.
Q: Which of the following samples would have the largest standard error of the mean
A:
Q: Given the following data. Find the mean: 2,3, 7, 8, 5, 0,1, 6 اختر احدى الدجابات O 2 O 3 O 4 None
A: GIven data is2,3,7,8,5,0,1,6Let x denotes the given data setx={2,3,7,8,5,0,1,6}sample size(n)=8
Q: What is the variance of X in the following data? -2 | -1 | 0 | 1 | 2 | 3 -3 -1 -2 4 Select one: 17.5…
A:
Q: Which of the following best describes the variance for this sample of observations: 2.3, 4.5, 6, 8…
A: In this question, we have data for which we have to calculate the standard deviation and tell that…
Q: Suppose n=24 n=24 and p=0.4 What is the standard deviation of p?
A: Given data, n=24 p=0.4 standard deviation of p=?
Q: Given a set of normally distributed scores with the mean of 20.00 and SD of 5.00, what proportion of…
A: We are givenμ = 20, σ = 5a)We have to find P( 10 < x < 28 )
Q: Four of your classmates measured the diagonal length of the blackboard. Classmate A measured it as…
A:
Step by step
Solved in 2 steps with 2 images