
Physical Chemistry
2nd Edition
ISBN:9781133958437
Author:Ball, David W. (david Warren), BAER, Tomas
Publisher:Ball, David W. (david Warren), BAER, Tomas
Chapter22: Surfaces
Section: Chapter Questions
Problem 22.49E

Related questions

Question
4.Based on the boiling point and surface tension values obtained, which of the two liquids has stronger IMFA?
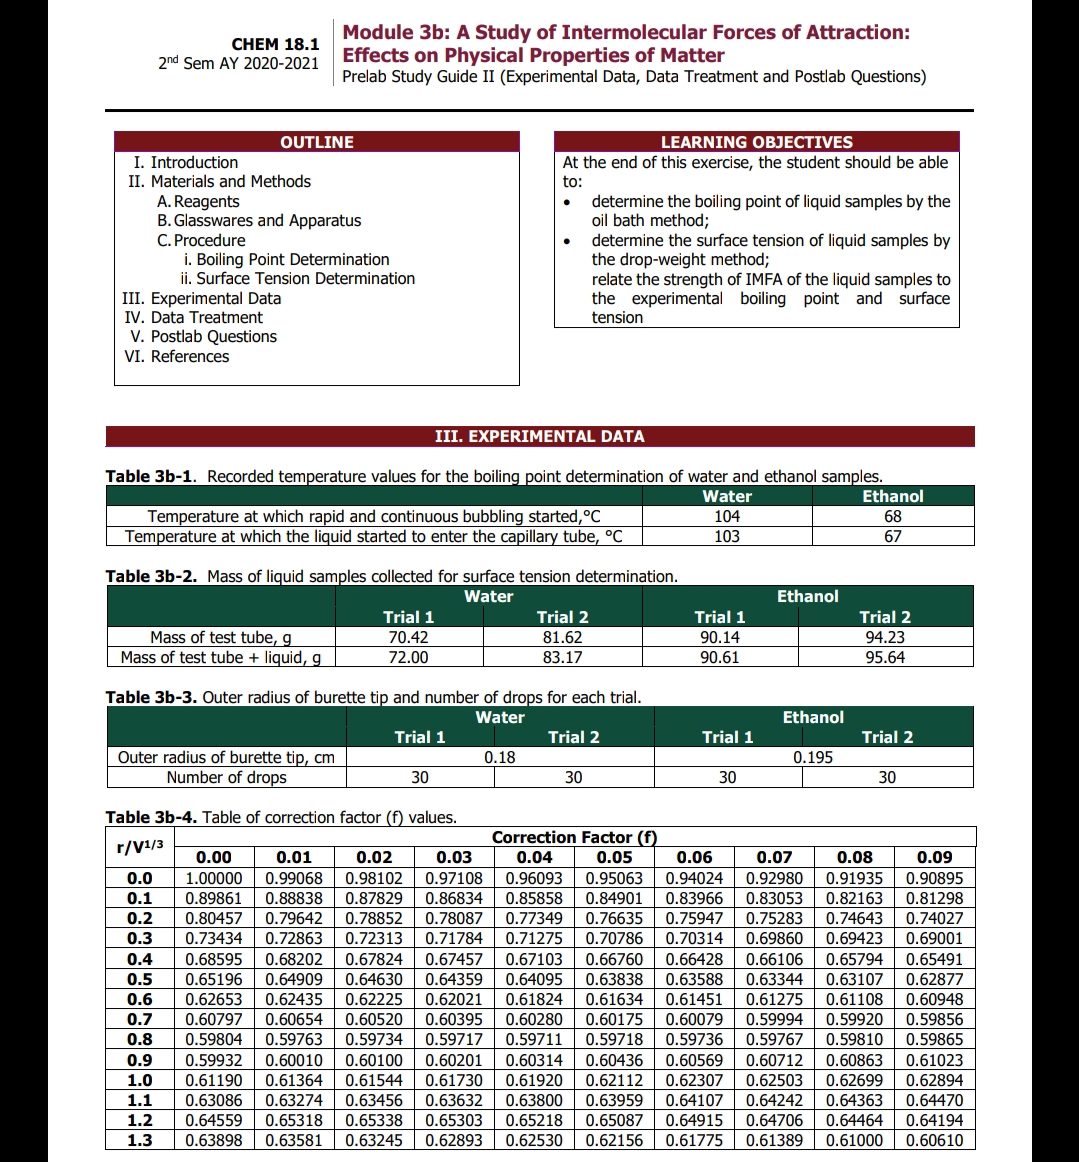
Transcribed Image Text:Module 3b: A Study of Intermolecular Forces of Attraction:
Effects on Physical Properties of Matter
Prelab Study Guide II (Experimental Data, Data Treatment and Postlab Questions)
CНEM 18.1
2nd Sem AY 2020-2021
OUTLINE
LEARNING OBJECTIVES
I. Introduction
At the end of this exercise, the student should be able
II. Materials and Methods
to:
A. Reagents
B. Glasswares and Apparatus
C. Procedure
i. Boiling Point Determination
ii. Surface Tension Determination
determine the boiling point of liquid samples by the
oil bath method;
determine the surface tension of liquid samples by
the drop-weight method;
relate the strength of IMFA of the liquid samples to
the experimental boiling point and surface
tension
III. Experimental Data
IV. Data Treatment
V. Postlab Questions
VI. References
III. EXPERIMENTAL DATA
Table 3b-1. Recorded temperature values for the boiling point determination of water and ethanol samples.
Water
Ethanol
Temperature at which rapid and continuous bubbling started,°C
Temperature at which the liquid started to enter the capillary tube, °C
104
68
103
67
Table 3b-2. Mass of liquid samples collected for surface tension determination.
Water
Ethanol
Trial 2
81.62
83.17
Trial 1
Trial 1
Trial 2
Mass of test tube, g
Mass of test tube + liquid, g
70.42
90.14
94.23
72.00
90.61
95.64
Table 3b-3. Outer radius of burette tip and number of drops for each trial.
Water
Ethanol
Trial 1
Trial 2
Trial 1
Trial 2
Outer radius of burette tip, cm
Number of drops
0.18
0.195
30
30
30
30
Table 3b-4. Table of correction factor (f) values.
Correction Factor (f)
r/V1/3
0.00
0.01
0.02
0.03
0.04
0.05
0.06
0.07
0.08
0.09
0.0
1.00000
0.99068
0.98102
0.97108
0.96093
0.95063
0.94024
0.92980
0.91935
0.90895
0.85858
0.77349
0.1
0.89861
0.88838
0.87829
0.86834
0.84901
0.83966
0.83053
0.82163
0.81298
0.80457
0.73434
0.79642
0.72863
0.78852
0.72313
0.78087
0.71784
0.2
0.76635
0.75947
0.75283
0.74643
0.74027
0.3
0.71275
0.70786
0.70314
0.69860
0.69423
0.69001
0.4
0.68595
0.68202
0.67824
0.67457
0.67103
0.66760
0.66428
0.66106
0.65794 0.65491
0.64909
0.62435
0.5
0.65196
0.64630
0.64359
0.64095
0.63838
0.63588
0.63344
0.63107
0.62877
0.6
0.62653
0.62225
0.62021
0.61824
0.61634
0.61451
0.61275
0.61108
0.60948
0.60079
0.59736
0.7
0.60797
0.60654
0.60520
0.60395
0.60280
0.60175
0.59994
0.59920
0.59856
0.8
0.59804
0.59763
0.59734
0.59717
0.59711
0.59718
0.59767
0.59810
0.59865
0.9
0.59932
0.60010
0.60100
0.60201
0.60314
0.60436
0.60569
0.60712
0.60863
0.61023
0.62699 0.62894
0.64363
0.64470
1.0
0.61190
0.61364
0.61544
0.61730
0.61920
0.62112
0.62307
0.62503
0.63959
0.65087 0.64915
1.1
0.63086
0.63456
0.63274
0.65318
0.63632
0.63800
0.64107
0.64242
0.65303
0.62893
1.2
0.64559
0.65338
0.65218
0.64706
0.64464
0.64194
1.3
0.63898
0.63581
0.63245
0.62530
0.62156
0.61775
0.61389
0.61000
0.60610
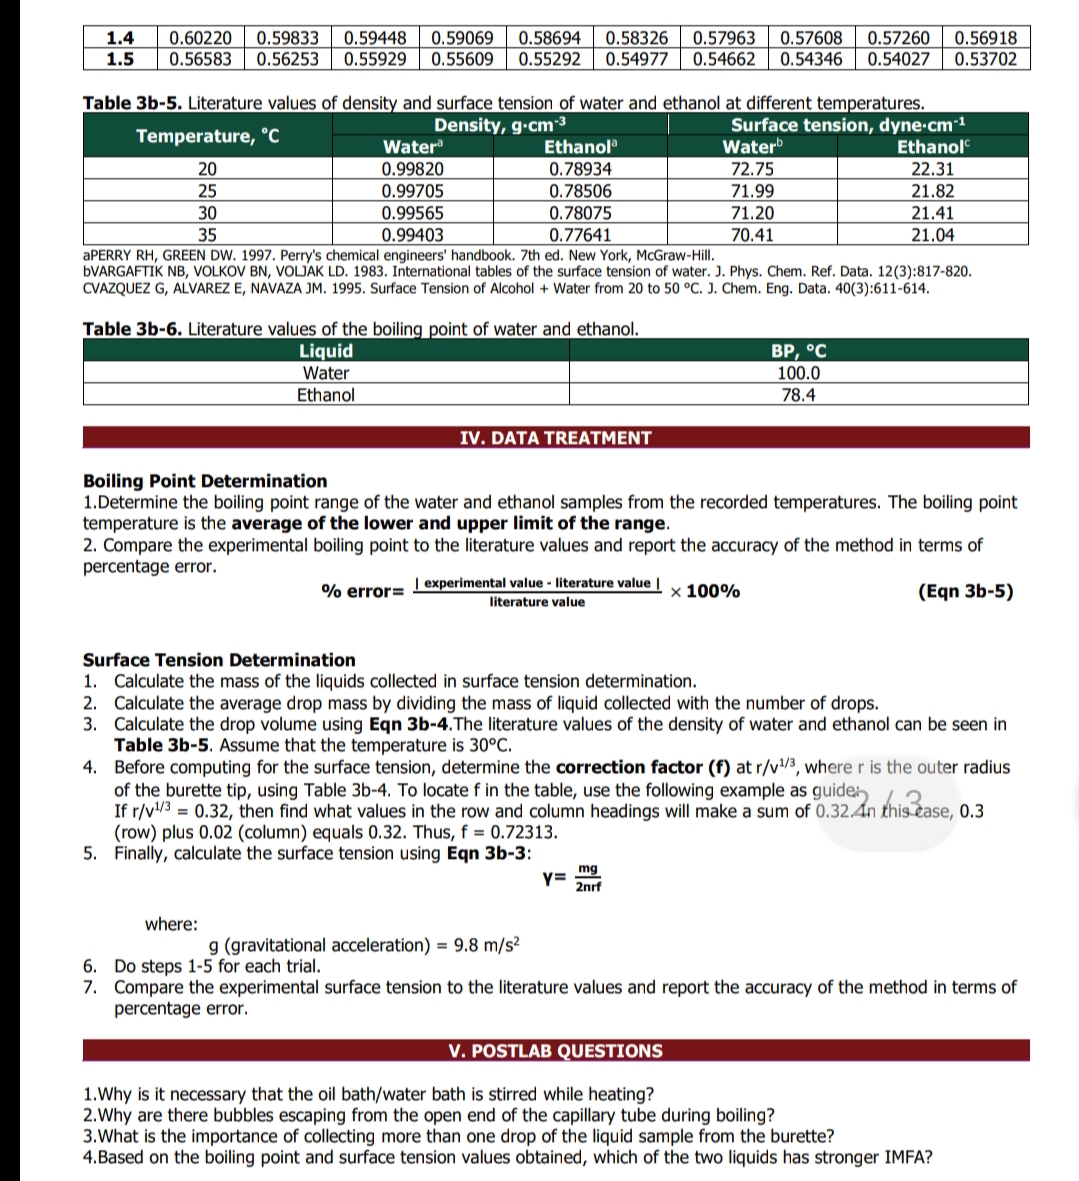
Transcribed Image Text:0.60220
0.56583
0.59833
0.58326
1.4
1.5
0.57963
0.54662
0.57260
0.54027
0.59448
0.59069
0.55609
0.58694
0.57608
0.54346
0.56918
0.53702
0.56253
0.55929
0.55292
0.54977
Table 3b-5. Literature values of density and surface tension of water and ethanol at different temperatures.
Density, g·cm³
Surface tension, dyne-cm-1
Waterb
72.75
71.99
Temperature, °C
Watera
Ethanol
Ethanol
20
0.99820
0.78934
22.31
25
0.99705
0.78506
21.82
71.20
70.41
30
0.99565
0.78075
21.41
21.04
35
0.99403
0.77641
APERRY RH, GREEN DW. 1997. Perry's chemical engineers' handbook. 7th ed. New York, McGraw-Hill.
BVARGAFTIK NB, VOLKOV BN, VOLLJAK LD. 1983. International tables of the surface tension of water. J. Phys. Chem. Ref. Data. 12(3):817-820.
CVAZQUEZ G, ALVAREZ E, NAVAZA JM. 1995. Surface Tension of Alcohol + Water from 20 to 50 °C. J. Chem. Eng. Data. 40(3):611-614.
Table 3b-6. Literature values of the boiling point of water and ethanol.
Liquid
Water
ВР, °С
100.0
Ethanol
78.4
IV. DATA TREATMENT
Boiling Point Determination
1.Determine the boiling point range of the water and ethanol samples from the recorded temperatures. The boiling point
temperature is the average of the lower and upper limit of the range.
2. Compare the experimental boiling point to the literature values and report the accuracy of the method in terms of
percentage error.
| experimental value - literature value |
% error=
x 100%
(Eqn 3b-5)
literature value
Surface Tension Determination
1. Calculate the mass of the liquids collected in surface tension determination.
2. Calculate the average drop mass by dividing the mass of liquid collected with the number of drops.
3. Calculate the drop volume using Eqn 3b-4.The literature values of the density of water and ethanol can be seen in
Table 3b-5. Assume that the temperature is 30°C.
4. Before computing for the surface tension, determine the correction factor (f) at r/v/³, wherer is the outer radius
of the burette tip, using Table 3b-4. To locate f in the table, use the following example as guide
If r/v/3 = 0.32, then find what values in the row and column headings will make a sum of 0.32.4n this case, 0.3
(row) plus 0.02 (column) equals 0.32. Thus, f = 0.72313.
5. Finally, calculate the surface tension using Eqn 3b-3:
mg
y=
2nrf
where:
g (gravitational acceleration) = 9.8 m/s²
6. Do steps 1-5 for each trial.
7. Compare the experimental surface tension to the literature values and report the accuracy of the method in terms of
percentage error.
V. POSTLAB QUESTIONS
1.Why is it necessary that the oil bath/water bath is stirred while heating?
2.Why are there bubbles escaping from the open end of the capillary tube during boiling?
3.What is the importance of collecting more than one drop of the liquid sample from the burette?
4.Based on the boiling point and surface tension values obtained, which of the two liquids has stronger IMFA?
Expert Solution
This question has been solved!
Explore an expertly crafted, step-by-step solution for a thorough understanding of key concepts.

Step by step
Solved in 4 steps

Knowledge Booster


Learn more about
Need a deep-dive on the concept behind this application? Look no further. Learn more about this topic, chemistry and related others by exploring similar questions and additional content below.Recommended textbooks for you
Physical Chemistry
Chemistry
ISBN:
9781133958437
Author:
Ball, David W. (david Warren), BAER, Tomas
Publisher:
Wadsworth Cengage Learning,
Physical Chemistry
Chemistry
ISBN:
9781133958437
Author:
Ball, David W. (david Warren), BAER, Tomas
Publisher:
Wadsworth Cengage Learning,