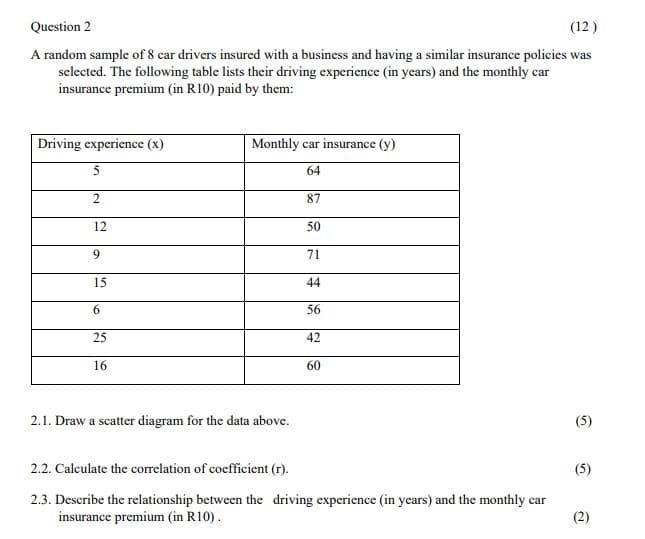
A random sample of 8 car drivers insured with a business and having a similar insurance policies selected. The following table lists their driving experience (in years) and the monthly car insurance premium (in R10) paid by them: Driving experience (x) Monthly car insurance (y) 64 2 87 12 50 71 15 44 6. 56 25 42 16 60 2.1. Draw a scatter diagram for the data above. 2.2. Calculate the correlation of coefficient (r). 2.3. Describe the relationship between the driving experience (in years) and the monthly car insurance premium (in R10).


Unitary Method
The word “unitary” comes from the word “unit”, which means a single and complete entity. In this method, we find the value of a unit product from the given number of products, and then we solve for the other number of products.
Speed, Time, and Distance
Imagine you and 3 of your friends are planning to go to the playground at 6 in the evening. Your house is one mile away from the playground and one of your friends named Jim must start at 5 pm to reach the playground by walk. The other two friends are 3 miles away.
Profit and Loss
The amount earned or lost on the sale of one or more items is referred to as the profit or loss on that item.
Units and Measurements
Measurements and comparisons are the foundation of science and engineering. We, therefore, need rules that tell us how things are measured and compared. For these measurements and comparisons, we perform certain experiments, and we will need the experiments to set up the devices.
Attaching question

Step by step
Solved in 4 steps with 1 images


