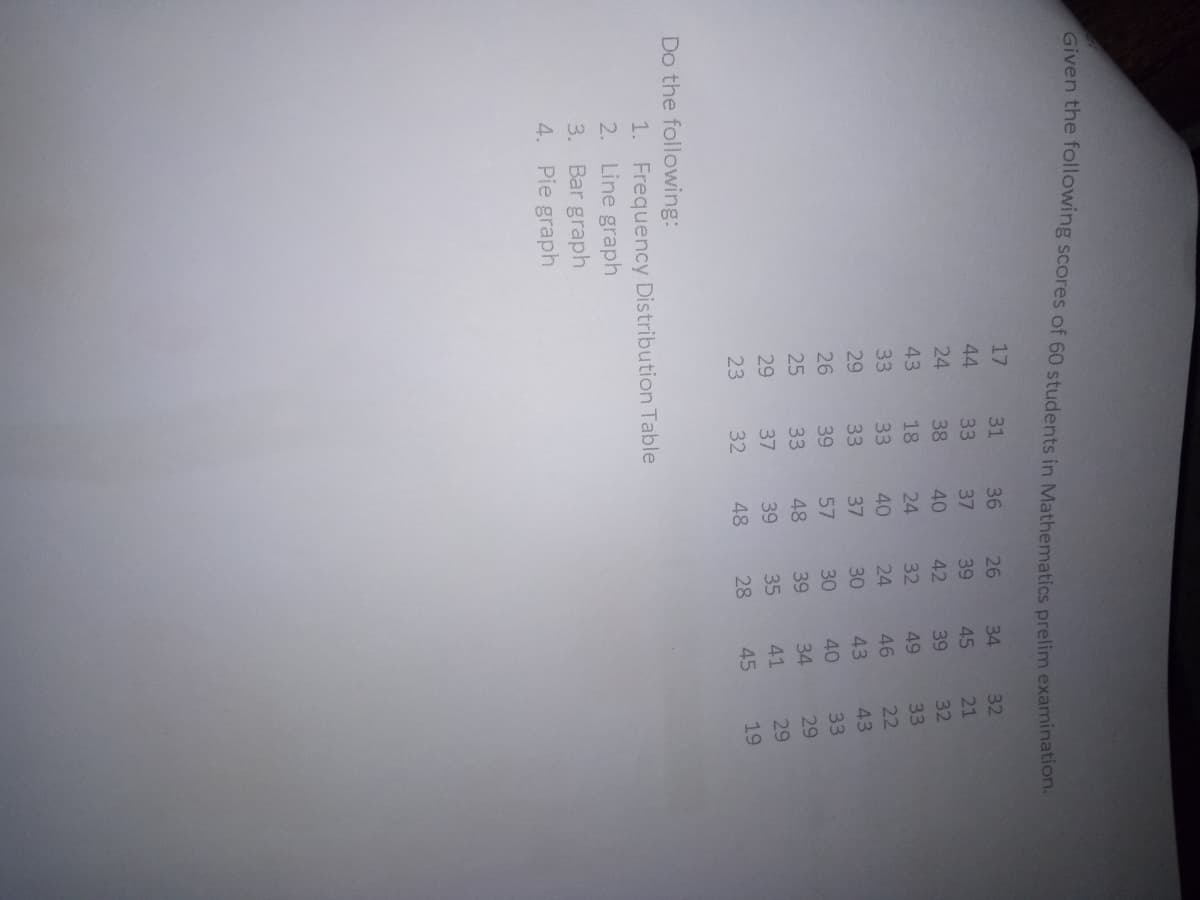
Given the following scores of 60 students in Mathematics prelim examination 17 31 36 26 34 32 44 33 37 39 45 21 24 38 40 42 39 32 43 18 24 32 49 33 33 33 40 24 46 22 29 33 37 30 43 43 26 39 57 30 40 33 25 33 48 39 34 29 29 37 39 35 41 29 23 32 48 28 45 19 Do the following: 1. Frequency Distribution Table 2. Line graph 3. Bar graph
Given the following scores of 60 students in Mathematics prelim examination 17 31 36 26 34 32 44 33 37 39 45 21 24 38 40 42 39 32 43 18 24 32 49 33 33 33 40 24 46 22 29 33 37 30 43 43 26 39 57 30 40 33 25 33 48 39 34 29 29 37 39 35 41 29 23 32 48 28 45 19 Do the following: 1. Frequency Distribution Table 2. Line graph 3. Bar graph

Glencoe Algebra 1, Student Edition, 9780079039897, 0079039898, 2018
18th Edition
ISBN:9780079039897
Author:Carter
Publisher:Carter
Chapter10: Statistics
Section10.6: Summarizing Categorical Data
Problem 4BGP

Related questions
Question
Transcribed Image Text:出功校的帥助
Given the following scores of 60 students in Mathematics prelim examination
17
31
26
34
32
44
33
39
45
21
24
38
42
39
32
43
18
32
49
33
33
33
22
29
33
43
39
57
33
33
48
29
29
37
29
19
23
32
Do the following:
1. Frequency Distribution Table
2. Line graph
3. Bar graph
4. Pie graph
Expert Solution
This question has been solved!
Explore an expertly crafted, step-by-step solution for a thorough understanding of key concepts.

Step by step
Solved in 2 steps with 2 images

Recommended textbooks for you
Glencoe Algebra 1, Student Edition, 9780079039897…
Algebra
ISBN:
9780079039897
Author:
Carter
Publisher:
McGraw Hill
Glencoe Algebra 1, Student Edition, 9780079039897…
Algebra
ISBN:
9780079039897
Author:
Carter
Publisher:
McGraw Hill