00 0 0 2222 The And 18 16 14 12 10 8 4 2 0 Strawberry-white chocolate Chocolate-cream cheese Use the bar graph to describe the distribution for the flavor of cupcake for the sample of 40 cupcakes. Coconut Lemon The cupcake ordered with the highest frequency is coconut (17) followed by Strawberry-white chocolate (10), Lemon (7) The cupcake ordered with the highest frequency is coconut (17) followed by Strawberry-white chocolate (10), Lemon (7) And Chocolate- cream cheese (6) cupcake ordered with the highest frequency is coconut (15) followed by Strawberry-white chocolate (12), Lemon (7) Chocolate-cream cheese (8) The cupcake ordered with the highest frequency is coconut (17) followed by Strawberry-white chocolate (14), Lemon (7) And Chocolate-cream cheese (2)
00 0 0 2222 The And 18 16 14 12 10 8 4 2 0 Strawberry-white chocolate Chocolate-cream cheese Use the bar graph to describe the distribution for the flavor of cupcake for the sample of 40 cupcakes. Coconut Lemon The cupcake ordered with the highest frequency is coconut (17) followed by Strawberry-white chocolate (10), Lemon (7) The cupcake ordered with the highest frequency is coconut (17) followed by Strawberry-white chocolate (10), Lemon (7) And Chocolate- cream cheese (6) cupcake ordered with the highest frequency is coconut (15) followed by Strawberry-white chocolate (12), Lemon (7) Chocolate-cream cheese (8) The cupcake ordered with the highest frequency is coconut (17) followed by Strawberry-white chocolate (14), Lemon (7) And Chocolate-cream cheese (2)

Algebra & Trigonometry with Analytic Geometry
13th Edition
ISBN:9781133382119
Author:Swokowski
Publisher:Swokowski
Chapter10: Sequences, Series, And Probability
Section10.8: Probability
Problem 32E

Related questions
Question
Transcribed Image Text:y Services X
3
14
15
16
virginiacommonwealth.instructure.com/courses/59477/external_tools/retrieve?display=full_width&url=https%3A%2F%2Fvirginiacommonwealth.quiz-Iti-ia... Q
17
esc
!
1
Q
A
Quizzes 2
1
Z
2
O O
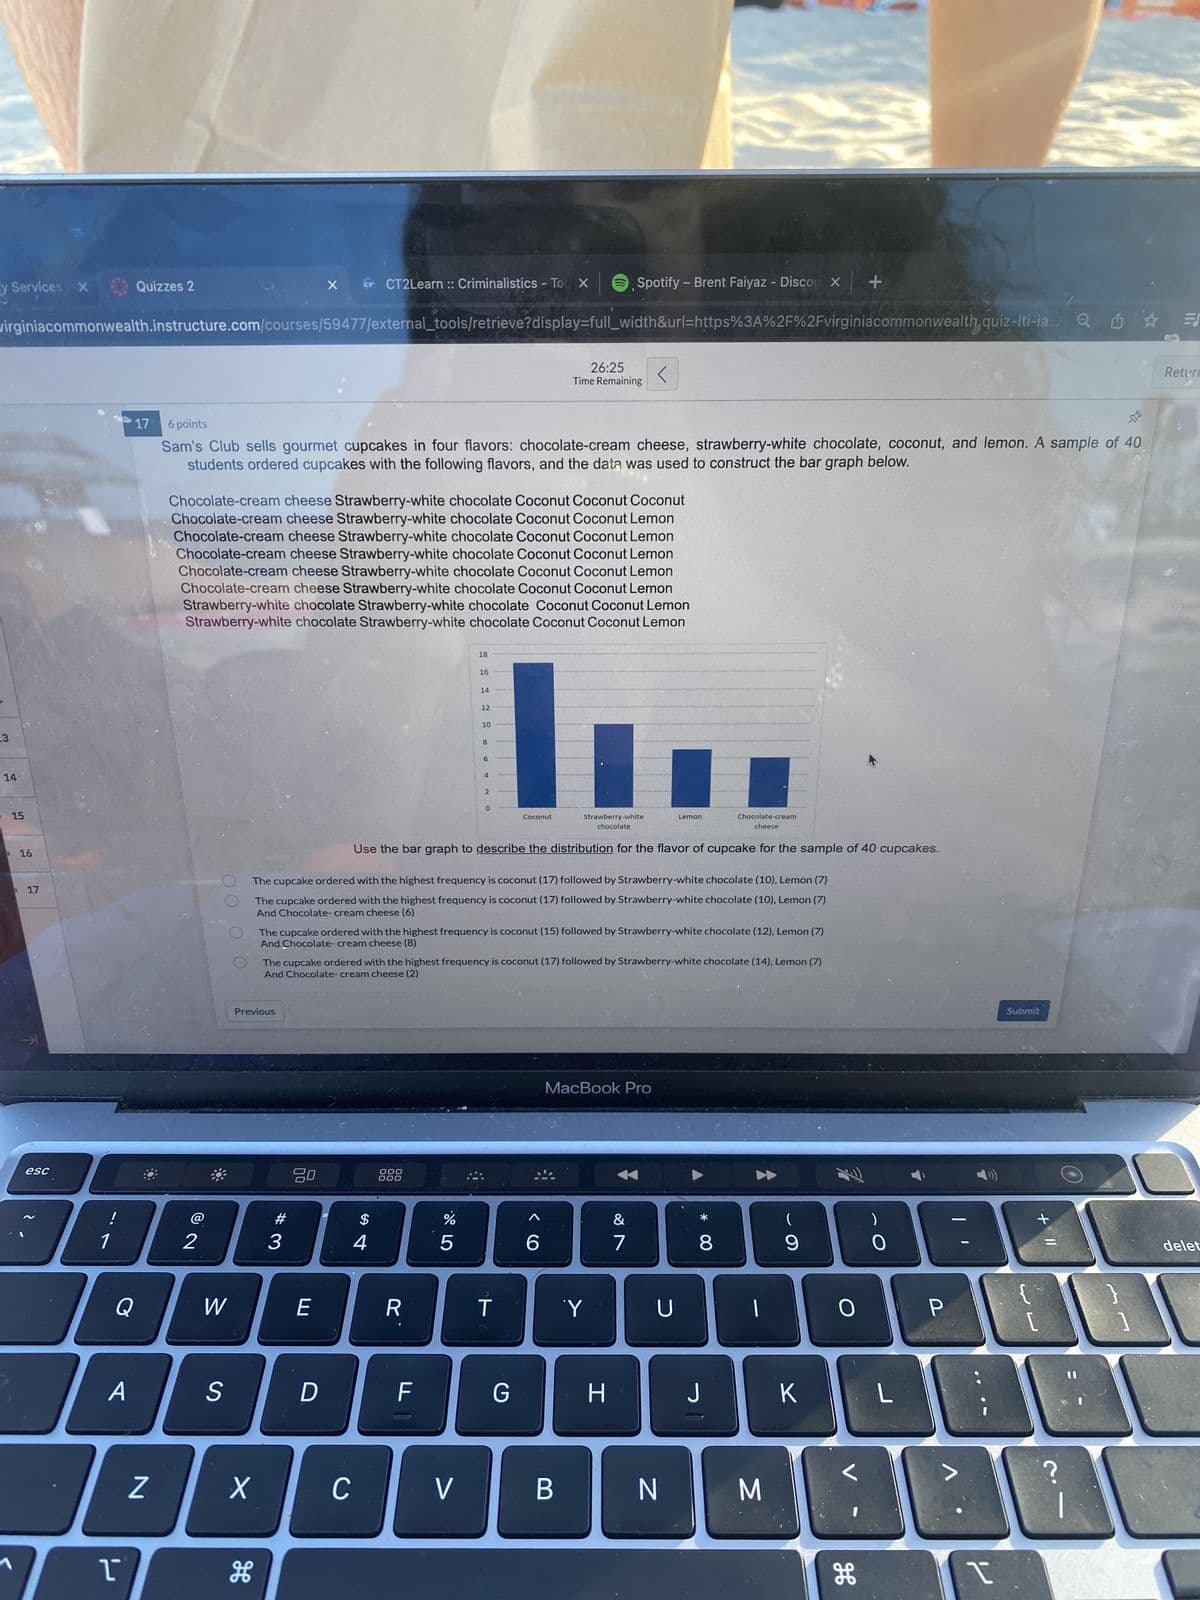
17 6 points
Sam's Club sells gourmet cupcakes in four flavors: chocolate-cream cheese, strawberry-white chocolate, coconut, and lemon. A sample of 40
students ordered cupcakes with the following flavors, and the data was used to construct the bar graph below.
W
S
Chocolate-cream cheese Strawberry-white chocolate Coconut Coconut Coconut
Chocolate-cream cheese Strawberry-white chocolate Coconut Coconut Lemon
Chocolate-cream cheese Strawberry-white chocolate Coconut Coconut Lemon
Chocolate-cream cheese Strawberry-white chocolate Coconut Coconut Lemon
Chocolate-cream cheese Strawberry-white chocolate Coconut Coconut Lemon
Chocolate-cream cheese Strawberry-white chocolate Coconut Coconut Lemon
Strawberry-white chocolate Strawberry-white chocolate Coconut Coconut Lemon
Strawberry-white chocolate Strawberry-white chocolate Coconut Coconut Lemon
X
X
Previous
H
CT
#3
CT2Learn :: Criminalistics - Too X
D
C
$
4
000
000
R
18
F
16
%
14
5
12
The cupcake ordered with the highest frequency is coconut (17) followed by Strawberry-white chocolate (10), Lemon (7)
The cupcake ordered with the highest frequency is coconut (17) followed by Strawberry-white chocolate (10), Lemon (7)
And Chocolate- cream cheese (6)
V
10
Chocolate-cream
cheese
Use the bar graph to describe the distribution for the flavor of cupcake for the sample of 40 cupcakes.
8
6
The cupcake ordered with the highest frequency is coconut (15) followed by Strawberry-white chocolate (12), Lemon (7)
And Chocolate-cream cheese (8)
4
The cupcake ordered with the highest frequency is coconut (17) followed by Strawberry-white chocolate (14), Lemon (7)
And Chocolate-cream cheese (2)
2
0
Coconut
T
Spotify - Brent Faiyaz - Discog X +
26:25 <
Time Remaining
G
6
Strawberry-white
chocolate
B
MacBook Pro
Y
H
&
7
Lemon
U
N
* 00
8
J
M
(
9
K
O
<
H
)
O
L
P
را
Submit
+ 11
?
Ih
Return
delet
Expert Solution
This question has been solved!
Explore an expertly crafted, step-by-step solution for a thorough understanding of key concepts.

Step by step
Solved in 2 steps

Recommended textbooks for you
Algebra & Trigonometry with Analytic Geometry
Algebra
ISBN:
9781133382119
Author:
Swokowski
Publisher:
Cengage

Algebra: Structure And Method, Book 1
Algebra
ISBN:
9780395977224
Author:
Richard G. Brown, Mary P. Dolciani, Robert H. Sorgenfrey, William L. Cole
Publisher:
McDougal Littell
Algebra & Trigonometry with Analytic Geometry
Algebra
ISBN:
9781133382119
Author:
Swokowski
Publisher:
Cengage
Algebra: Structure And Method, Book 1
Algebra
ISBN:
9780395977224
Author:
Richard G. Brown, Mary P. Dolciani, Robert H. Sorgenfrey, William L. Cole
Publisher:
McDougal Littell