(b) Check Requirements: What distribution does the sample test statistic follow? Explain. O The standard normal. The number of trials is sufficiently large. O The Student's t. The number of trials is sufficiently large. The standard normal. We assume the population distributions are approximately normal. O The Student's r. We assume the population distributions are approximately normal. (c) State the hypotheses. ⒸHg: P1 ⒸHg: P₁ P₂ H₁: P1 ⒸHg: P₁
(b) Check Requirements: What distribution does the sample test statistic follow? Explain. O The standard normal. The number of trials is sufficiently large. O The Student's t. The number of trials is sufficiently large. The standard normal. We assume the population distributions are approximately normal. O The Student's r. We assume the population distributions are approximately normal. (c) State the hypotheses. ⒸHg: P1 ⒸHg: P₁ P₂ H₁: P1 ⒸHg: P₁

College Algebra
7th Edition
ISBN:9781305115545
Author:James Stewart, Lothar Redlin, Saleem Watson
Publisher:James Stewart, Lothar Redlin, Saleem Watson
Chapter9: Counting And Probability
Section9.3: Binomial Probability
Problem 2E: If a binomial experiment has probability p success, then the probability of failure is...

Related questions
Question
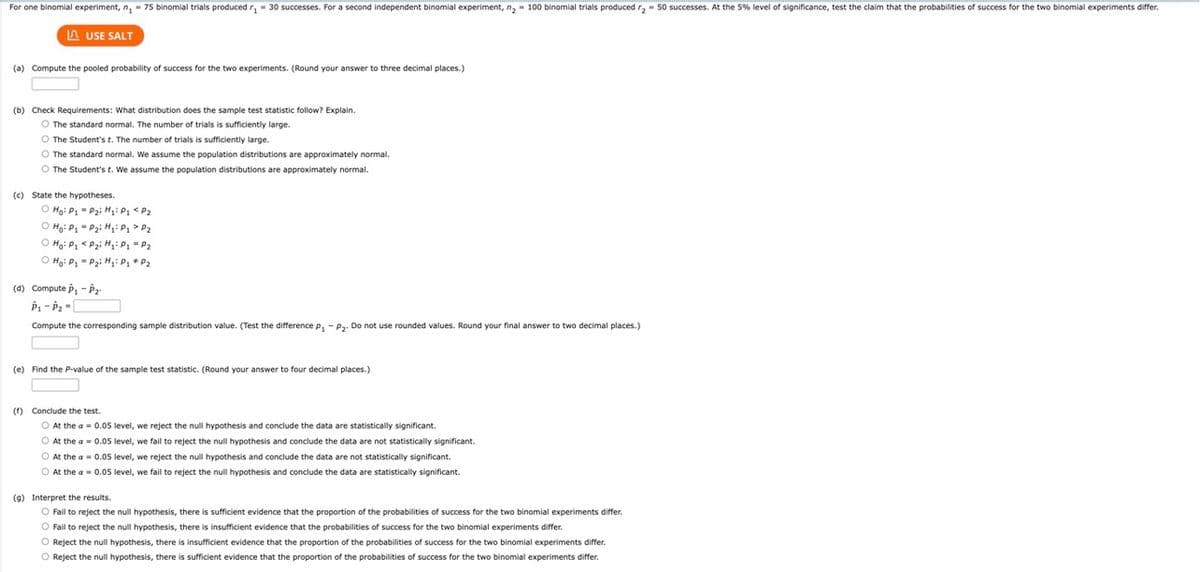
Transcribed Image Text:For one binomial experiment, n₁ = 75 binomial trials produced r₁= 30 successes. For a second independent binomial experiment, n₂ = 100 binomial trials produced r₂ = 50 successes. At the 5% level of significance, test the claim that the probabilities of success for the two binomial experiments differ.
LAUSE SALT
(a) Compute the pooled probability of success for the two experiments. (Round your answer to three decimal places.)
(b) Check Requirements: What distribution does the sample test statistic follow? Explain.
O The standard normal. The number of trials is sufficiently large.
O The Student's t. The number of trials is sufficiently large.
O The standard normal. We assume the population distributions are approximately normal.
O The Student's t. We assume the population distributions are approximately normal.
(c) State the hypotheses.
Ho: P₁P₂i H₂: P₁ < P₂
P₂i H₂i Pq > P₂
P₂i H₂: P₁ = P₂
P₂i H₂: P₁ P₂
O Ho: P₁
O Ho: P₁
O Ho: P₁
(d) Compute P₁-P₂
P₁-P₂=[
Compute the corresponding sample distribution value. (Test the difference P₁ - P₂. Do not use rounded values. Round your final answer to two decimal places.)
(e) Find the P-value of the sample test statistic. (Round your answer to four decimal places.)
(f) Conclude the test.
O At the a= 0.05 level, we reject the null hypothesis and conclude the data are statistically significant.
O At the a= 0.05 level, we fail to reject the null hypothesis and conclude the data are not statistically significant.
O At the a= 0.05 level, we reject the null hypothesis and conclude the data are not statistically significant.
O At the a= 0.05 level, we fail to reject the null hypothesis and conclude the data are statistically significant.
(9) Interpret the results.
O Fail to reject the null hypothesis, there is sufficient evidence that the proportion of the probabilities of success for the two binomial experiments differ.
O Fail to reject the null hypothesis, there is insufficient evidence that the probabilities of success for the two binomial experiments differ.
O Reject the null hypothesis, there is insufficient evidence that the proportion of the probabilities of success for the two binomial experiments differ.
O Reject the null hypothesis, there is sufficient evidence that the proportion of the probabilities of success for the two binomial experiments differ
Expert Solution
This question has been solved!
Explore an expertly crafted, step-by-step solution for a thorough understanding of key concepts.

Step by step
Solved in 3 steps

Recommended textbooks for you
College Algebra
Algebra
ISBN:
9781305115545
Author:
James Stewart, Lothar Redlin, Saleem Watson
Publisher:
Cengage Learning

College Algebra
Algebra
ISBN:
9781305115545
Author:
James Stewart, Lothar Redlin, Saleem Watson
Publisher:
Cengage Learning