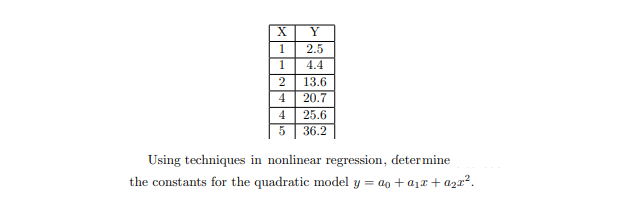
1 2.5 4.4 2 13.6 4 20.7 25.6 36.2 Using techniques in nonlinear regression, determine the constants for the quadratic model y = ao a1a2r2


Q: 1 2.5 4.4 2 13.6 4 20.7 4 25.6 36.2 Using the data transformation in the nonlinear regression…
A: Consider the given table.The given table is as follows.
Q: 0.21 0.14 0.11 0.13 0.12 0.13 ... 1.10 1.50 1.90 2.20 2.60 3.20 a. Fit a linear regression equation…
A:
Q: 9.4.3 The volume (in cubic feet) of a black cherry tree can be modeled by the equation y = - 50.4 +…
A: Given regression equation
Q: Need help with entirety of the problem.
A: Solution: Given data represents the end-of-year assets in billions of dollars for the Medicare…
Q: 3. Using multiple linear regression, estimate the values of a, b and c in the given regression…
A:
Q: 2. The table below shows the profit, P(x), in dollars, from selling x items. 1 2 3 6 9 14 P(x) |…
A: GivenP(x)=4.9x2-27.3x-49 ...(1)
Q: 1 2 3 4 5 6 y 0.5 2.5 2.0 4.0 3.5 6.0 a. Fit a linear regression equation b. Compute for r
A:
Q: Determine the regression equation in y = ax + b form and write it below. (Round to 2 decimal places)…
A:
Q: Consider the linear regression model: log(wage)-B1+B2 MATH+B3 ARABIC +e where wage is the hourly…
A: Null hypothesis :It is a statement about the population that either is believed to be true or…
Q: 1. You collect the following production data for your firm: L a. Which functional form (linear,…
A: Note:- Since you have posted a question with multiple sub-parts, we will solve first three sub-parts…
Q: part d
A: According to the provided information, the expected cost (y dollars) of a production run is related…
Q: An unknown metal has been found and the following experimental results have been tabulated in the…
A: Given :
Q: MoneySupply (in billion) Year 2011 1 83 2012 2 89 2013 3 96 2014 4 98 2015 5 98 2016 6. 70 2017 7 84…
A: Solution: x y x^2 y^2 x⋅y 1 83 1 6889 83 2 89 4 7921 178 3 96 9 9216 288 4 98 16 9604 392…
Q: The following table shows, for a certain chemical reaction, the rate of reaction R, in moles per…
A: The solution is given by using least square approximation method as follows
Q: Consider the following training set for a regression task. Length Width Output 25 25 120 15 30 95 20…
A: Consider the following regression model with intercept term: Ynx1=Xnxpβpx1+εnx1 where Y = Dependent…
Q: c. Ignore for now the months since the last maintenance service and the type of repair associated…
A: Given: n=10 Bob Jones is coded as 0. Dave Newton is coded as1.
Q: 10) The following table gives the number of weekly customers to visit a store since May 1. 3. 5n 6.…
A: 10. a) Let V(x) denotes the number of customers visited x weeks since May 1. Find a quadratic…
Q: a)State in algebraic notation and explain the assumption about the classical linear regression…
A: a)
Q: Consider the linear regression model given by ŷ = 6.553 0.0312 x determination coefficient R and the…
A: Givenlinear regression model is y^=6.553-0.0312(x)R2=0.64
Q: X 0.21 0.14 0.11 0.13 0.12 0.13 1.10 1.50 1.90 2.20 2.60 3.20 a. Fit a linear regression equation b.…
A:
Q: In a study of pollution in a water stream, the concentration of pollution is mea- sured at 5…
A:
Q: 1 2 3 4 1064 1547 2247 3045 4161 5929 Use linear regression to find the equation for the linear…
A:
Q: Consider the linear regression model Y, = Bo + B1 X + U; for each i = 1,...,n with n = 1,000. X,…
A:
Q: Which of the following is (are) TRUE?
A: Here given , the multiple linear regression model, Copra Yield=25+3.2*number of nuts1 -1.7*nut…
Q: b. The compressive strength of a concrete and the curing time are believed to related. An…
A: Let X be the compressive strength and Y be the curing time as a dependent variable. The linear…
Q: 21 22 54 34 2 44 28 58 40 4 42 30 4 49 35 4 56 40 The multiple linear regression equation of the…
A: From the provided information, The multiple linear regression equation is as follow:
Q: 1. |We wish to determine a regression equation that relates the length of an infant (in cm) to age…
A: *answer: *e Statistical significance: Since p-valueage (0.000475) < 0.01, it is concluded that…
Q: Month Price Jan 2020 $42.28 Mar 2020 $39.49 July 2020 $37.98 Aug 2020 $39.09 Sept 2020 $40.30 Nov…
A: “Since you have posted a question with multiple sub-parts, we will solve the first three sub-parts…
Q: 1) Sara believes that as she increases her walking speed, her pulse rate will increase. Sara records…
A: Here, we want to test if the relationship between walking speed and pulse rate is related or not,…
Q: Suppose you want to test whether consumption and income are linearly related using the estimates…
A: Regression analysis is a statistical technique that determines the relationship between the…
Q: I1 12 50 29 47 33 46 28 1 42 20 3. 58 21 42 22 The multiple linear regression equation of the table…
A: The given multiple linear regression is : y^=-6.99+0.17x1+0.03x2
Q: Two econometricians fit regressions using the same data but different sets of explanatory variables.…
A: GivenThe regression equation for estimating Y, with independent variables X1, X2 is shown…
Q: 1980 30.3 1990 38.3 2000 45.6 2010 50.5 Let r represent time (in years) since 1970, and let y…
A: NOTE: Refresh your page if you can't see any equations. . use the calculator to find the cubic…
Q: 32 18 15 26 y 9 20 21 17 21 Develop an estimated regression equation for the data of ý = Common the…
A: Given, a) using excel data analysis tool for regression,steps are: write…
Q: Q2 (a)State in algebraic notation and explain the assumption about the classical linear regression…
A: In a simple linear regression model, the residual plot gives us the graphical representation of…
Q: An unknown metal has been found and the following experimental results have been tabulated in the…
A: Given data, X Y X*Y X*X 18 244.7 4404.6 324 19.5 270.4 5272.8 380.25 21 291.2 6115.2 441…
Q: The following table shows, for a certain chemical reaction, the rate of reaction R, in moles per…
A: From the given information. The tabulated data of concentration and reaction rate is as follows.…
Q: 1. (True/False) A Simple Linear Regression Equation is found y = 1.456 + 5.33x based on a sample of…
A:
Q: 2 3 4 6. 231 253.3 273.8 284.1 294.1 303.6 368.6 383.7 Determine the cubic regression function that…
A: Explanation of the solution is given below...
Q: Following are data on the worldwide shipments of personal computers (in thousands) according to…
A: (a) Here we use Excel to fit a linear model to the data using linear regression. Steps are as…
Q: Consider the simple linear regression model Wage = Bo + B1*Age + U. The error term U can capture the…
A: Given: simple linear regression model Wage = β0 + β1*Age + U
Q: Estimate b4 in the multiple regression model. Use 2 decimal places. y = b0 + b1 x1 + b2 x2 + b3 x3 +…
A: Regressing Y=y on x1=X1 , x2=X3 , x3=X3 , x4=X4 and given Y =b0+b1x1+b2x2+b3x3+b4x4 now we use…
Q: 22 50 29 47 33 46 28 42 20 58 21 42 22 The multiple linear regression equation of the table is shown…
A: Introduction: The estimated least squares linear regression equation to predict the response…
Q: Town A B C D E F G Population (lakh) (X ) 11 14 14 17 17 21 25 No. of TV sets demanded ('000) (Y )…
A: Given The data is as follows: Town Population (lakh) (X) No. of TV sets demanded ('000) (Y) A…
Q: Consider the following time series: t sales 1 6. 2 10 8. 4 12 5 16 Use simple linear regression…
A: For simple linear regression in excel- Enter data into spreadsheet. Go to Data>Data…
Q: Î; = 4 + 3X,, +5.5x a. Predict Y for X, = 3. (Type an integer or a decimal.)
A: Y^ = 4+3X+5.5X2
Q: Consider the linear regression model Y; = Bo + Bị X; + U¡ and assume that E(Ui|X¡) = 0 for each i =…
A: # given a regression model hi=b0+b1*x +ui Then to define the value of b1 (slope)

Step by step
Solved in 3 steps with 3 images

- A sixth-grade teacher believes that there is a relationship between his students’ IQscores (y) and the numbers of hours (x) they spend watching television each week. Thefollowing table shows a random sample of 7 sixth-grade students.y 125 116 97 114 85 107 105x 5 10 30 16 41 28 21 Does the data provide sufficient evidence to indicate that the simple linear regressionmodel is appropriate to describe the relationship between x and y? Perform a model utilitytest at α = 0.05. (Give H0, Ha, rejection region, observed test statistic, P-value, decisionand conclusion.)Find the Pearson sample correlation coefficient between x and y. Then interpretthe result.he following table shows the annual number of PhD graduates in a country in various fields. NaturalSciences Engineering SocialSciences Education 1990 70 10 60 30 1995 130 40 100 50 2000 330 130 280 140 2005 490 370 460 210 2010 590 550 830 520 2012 690 590 1,000 900 (a)With x = the number of social science doctorates and y = the number of education doctorates, use technology to obtain the regression equation. (Round coefficients to three significant digits.) y(x) = Use technology to obtain the coefficient of correlation r. (Round your answer to three decimal places.) r =An econometrician suspects that the residuals of her model might be autocorrelated. Explain the steps involved in testing this theory using the Durbin–Watson (DW) test
- The following table shows the annual number of PhD graduates in a country in various fields. NaturalSciences Engineering SocialSciences Education 1990 70 10 70 30 1995 130 40 110 40 2000 330 130 280 120 2005 490 370 460 210 2010 590 550 830 520 2012 690 590 1,000 900 (a) With x = the number of social science doctorates and y = the number of education doctorates, use technology to obtain the regression equation. (Round coefficients to three significant digits.) y(x) = (b) Use technology to obtain the coefficient of correlation r. (Round your answer to three decimal places.) r =The following table shows the annual number of PhD graduates in a country in various fields. NaturalSciences Engineering SocialSciences Education 1990 70 10 60 30 1995 130 40 100 50 2000 330 130 280 140 2005 490 370 460 210 2010 590 550 830 520 2012 690 590 1,000 900 (a) With x = the number of social science doctorates and y = the number of education doctorates, use technology to obtain the regression equation. (Round coefficients to three significant digits.) y(x) =Consider the following datasets: X1=2,8,4 X2= 0.4, 7.10, 3.2 Y= 2.6, 9.2, 5.3 Statistically regress Y on X1 and X2, i.e. find a regression equation in which output variable is Y and input variable is X1 and X2. Show first two iterations of Gradient Descent method to solve part a. Initialize slopes and intercept at 0 value.
- Snowpacks contain a wide spectrum of pollutants thatmay represent environmental hazards. The article“Atmospheric PAH Deposition: Deposition Velocitiesand Washout Ratios” (J. of EnvironmentalEngineering, 2002: 186–195) focused on the depositionof polyaromatic hydrocarbons. The authors proposeda multiple regression model for relating depositionover a specified time period (y, in mg/m2) to tworather complicated predictors x1 (mg-sec/m3) and x2 (mg/m2), defined in terms of PAH air concentrations forvarious species, total time, and total amount of precipitation.Here is data on the species fluoranthene andcorresponding Minitab output:obs x1 x2 flth1 92017 .0026900 278.782 51830 .0030000 124.533 17236 .0000196 22.654 15776 .0000360 28.685 33462 .0004960 32.666 243500 .0038900 604.707 67793 .0011200 27.698 23471 .0006400 14.189 13948 .0004850 20.6410 8824 .0003660 20.6011 7699 .0002290 16.6112 15791 .0014100 15.0813 10239 .0004100 18.0514 43835 .0000960 99.7115 49793 .0000896 58.9716 40656…The following table shows the annual number of PhD graduates in a country in various fields. NaturalSciences Engineering SocialSciences Education 1990 70 10 60 30 1995 130 40 120 40 2000 330 130 280 120 2005 490 370 460 210 2010 590 550 830 520 2012 690 590 1,000 900 (a)With x = the number of social science doctorates and y = the number of education doctorates, use technology to obtain the regression equation. (Round coefficients to three significant digits.) y(x) =Suppose we want to predict job performance of mechanics based on mechanical aptitude test scores and test scores from personality test that measures conscientiousness. (a) Determine the regression equation. (b) Determine the SSE. Y X1 X2 1 40 25 2 45 20 1 38 30 3 50 30 2 48 28 3 55 30 3 53 34 4 55 36 4 58 32 3 40 34 5 55 38 3 48 28 3 45 30 2 55 36 4 60 34 5 60 38 5 60 42 5 65 38 4 50 34 3 58 38 Where Y is the Performance of the mechanics, X1 is the mechanical aptitude test and X2 is the personality test score that measure conscientiousness.
- For the regression model Yi = b0 + eI, derive the least squares estimator.The marketing manager of a supermarket chain would like to determine the effect of shelf spaceon the sales of pet food. A random sample of 10 stores was selected, and the results are presentedbelow. Store shelf space in cm weekly sales in thousand pesos 1 45 18 2 45 21 3 75 15 4 80 18 5 95 23 6 100 26 7 135 22 8 140 27 9 185 25 10 190 28 d. Using the estimated simple linear regression equation Y=15.6414+0.0611X, estimate the weekly sales when theshelf space is 230cm? 250cm? e. Compute the coefficient of determination and interpret its value.A fitted linear regression model is (y=10+2x ). If x = 0 and the corresponding observed value of y = 9, the residual at this observation is:


