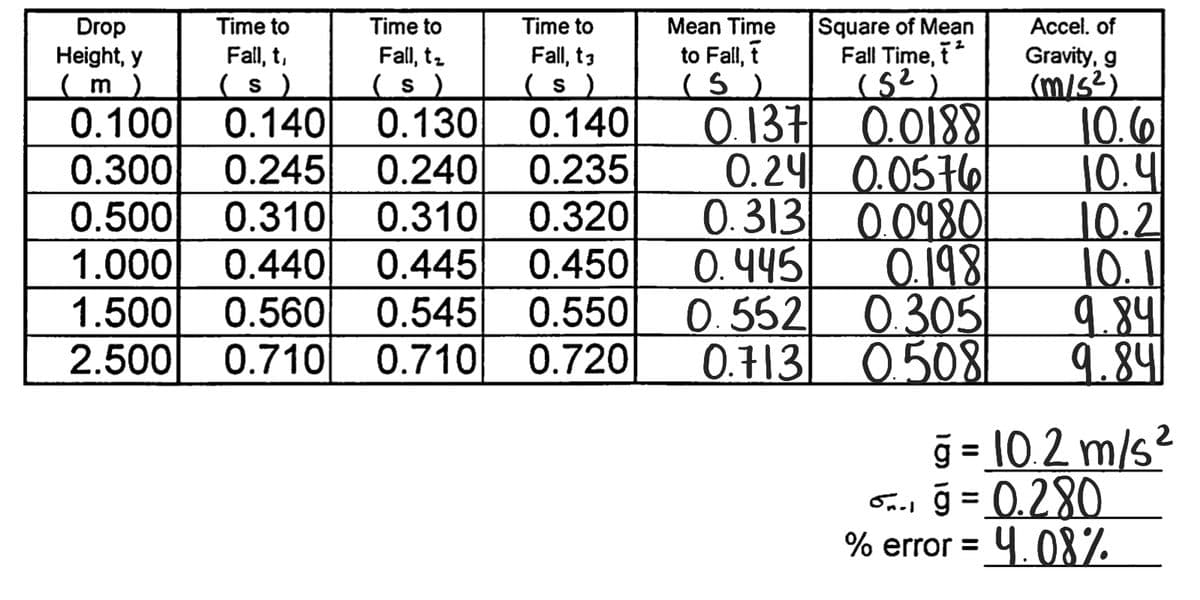
1) Graph 1: plot t on the abscissa versus y on the ordinate and (artistically) draw a smooth line through the points. The line need not actually go through each data point. 2) Graph 2: plot t^2 on the abscissa versus y on the ordinate and then perform a linear regression. Remember to plot both the raw data points and the line of best fit (with the two points used to draw it); also show the regression equation and r value on the graph. 3) On graph (1), what does the slope of the line tell you about the velocity of the ball? Be thorough! 4) On graph 2: a) What does the slope of the line tell you about the acceleration of the ball? Be thorough! b) Calculate g from the freefall data and the % error (in comparison to 9.81 m/s^2) using the results from the linear regression calculation. c) What do the values of the y-intercept and correlation coefficient (r) tell you?


1) Graph 1: plot t on the abscissa versus y on the ordinate and (artistically) draw a smooth line through the points. The line need not actually go through each data point.
2) Graph 2: plot t^2 on the abscissa versus y on the ordinate and then perform a linear regression. Remember to plot both the raw data points and the line of best fit (with the two points used to draw it); also show the regression equation and r value on the graph.
3) On graph (1), what does the slope of the line tell you about the velocity of the ball? Be thorough!
4) On graph 2:
a) What does the slope of the line tell you about the acceleration of the ball? Be thorough!
b) Calculate g from the freefall data and the % error (in comparison to 9.81 m/s^2) using the results from the linear regression calculation.
c) What do the values of the y-intercept and correlation coefficient (r) tell you?


Trending now
This is a popular solution!

Step by step
Solved in 2 steps with 6 images


