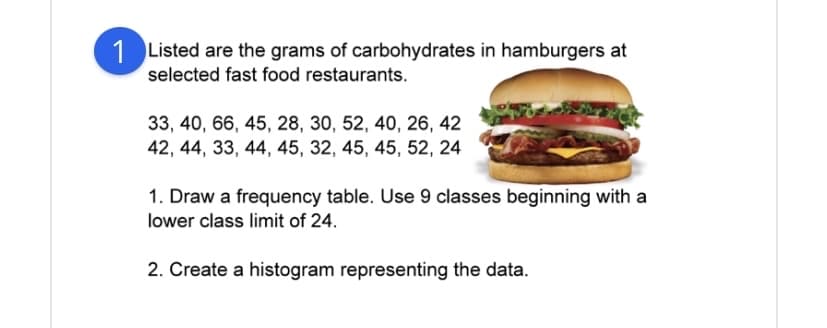
1 Listed are the grams of carbohydrates in hamburgers at selected fast food restaurants. 33, 40, 66, 45, 28, 30, 52, 40, 26, 42 42, 44, 33, 44, 45, 32, 45, 45, 52, 24 1. Draw a frequency table. Use 9 classes beginning with a lower class limit of 24. 2. Create a histogram representing the data.
1 Listed are the grams of carbohydrates in hamburgers at selected fast food restaurants. 33, 40, 66, 45, 28, 30, 52, 40, 26, 42 42, 44, 33, 44, 45, 32, 45, 45, 52, 24 1. Draw a frequency table. Use 9 classes beginning with a lower class limit of 24. 2. Create a histogram representing the data.

Glencoe Algebra 1, Student Edition, 9780079039897, 0079039898, 2018
18th Edition
ISBN:9780079039897
Author:Carter
Publisher:Carter
Chapter10: Statistics
Section10.5: Comparing Sets Of Data
Problem 14PPS

Related questions
Question
Transcribed Image Text:1 Listed are the grams of carbohydrates in hamburgers at
selected fast food restaurants.
33, 40, 66, 45, 28, 30, 52, 40, 26, 42
42, 44, 33, 44, 45, 32, 45, 45, 52, 24
1. Draw a frequency table. Use 9 classes beginning with a
lower class limit of 24.
2. Create a histogram representing the data.
Expert Solution
This question has been solved!
Explore an expertly crafted, step-by-step solution for a thorough understanding of key concepts.

Step by step
Solved in 3 steps with 3 images

Recommended textbooks for you
Glencoe Algebra 1, Student Edition, 9780079039897…
Algebra
ISBN:
9780079039897
Author:
Carter
Publisher:
McGraw Hill

Holt Mcdougal Larson Pre-algebra: Student Edition…
Algebra
ISBN:
9780547587776
Author:
HOLT MCDOUGAL
Publisher:
HOLT MCDOUGAL
Glencoe Algebra 1, Student Edition, 9780079039897…
Algebra
ISBN:
9780079039897
Author:
Carter
Publisher:
McGraw Hill
Holt Mcdougal Larson Pre-algebra: Student Edition…
Algebra
ISBN:
9780547587776
Author:
HOLT MCDOUGAL
Publisher:
HOLT MCDOUGAL