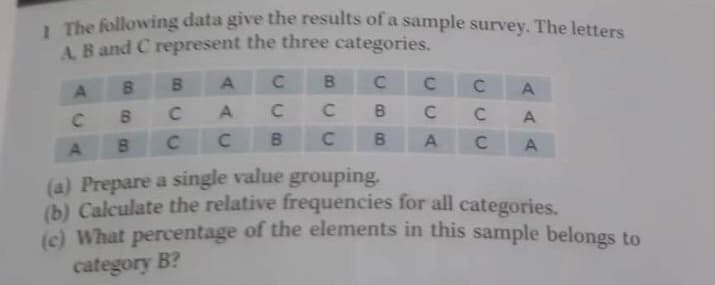
1 The following data give the results of a sample survey. The letters A B and C represent the three categories. B0 B3 C2 B. C2 A. C. A C. B. C. B. A C (a) Prepare a single value grouping. (b) Calculate the relative frequencies for all categories. ie) What percentage of the elements in this sample belonas to category B?
1 The following data give the results of a sample survey. The letters A B and C represent the three categories. B0 B3 C2 B. C2 A. C. A C. B. C. B. A C (a) Prepare a single value grouping. (b) Calculate the relative frequencies for all categories. ie) What percentage of the elements in this sample belonas to category B?

Glencoe Algebra 1, Student Edition, 9780079039897, 0079039898, 2018
18th Edition
ISBN:9780079039897
Author:Carter
Publisher:Carter
Chapter10: Statistics
Section10.6: Summarizing Categorical Data
Problem 4AGP

Related questions
Question
100%
Transcribed Image Text:The following data give the results of a sample survey, The letters
A B and C represent the three categories.
B.
B.
B.
C.
C.
A.
C
C
A
C
B.
A.
C.
A
(a) Prepare a single value grouping.
(b) Calculate the relative frequencies for all categories.
percentage of the elements in this sample belongs to
(c) What
category B?
Expert Solution
This question has been solved!
Explore an expertly crafted, step-by-step solution for a thorough understanding of key concepts.

This is a popular solution!

Trending now
This is a popular solution!

Step by step
Solved in 3 steps

Knowledge Booster


Learn more about
Need a deep-dive on the concept behind this application? Look no further. Learn more about this topic, statistics and related others by exploring similar questions and additional content below.Recommended textbooks for you
Glencoe Algebra 1, Student Edition, 9780079039897…
Algebra
ISBN:
9780079039897
Author:
Carter
Publisher:
McGraw Hill
Glencoe Algebra 1, Student Edition, 9780079039897…
Algebra
ISBN:
9780079039897
Author:
Carter
Publisher:
McGraw Hill