(1-Show a frequency distribution of the final grades in mathematics & Statistics of 30 students are recorded in the accompanying table . Stat. Math. Stat. Math. Stat. Math. Stat. Math. Stat. Math. 50 55 80 75 53 50 57 90 76 71 70 72 68 72 65 73 75 93 93 81 80 62 65 85 86 90 92 64 67 61 60 83 82 56 52 74 72 94 96 82 85 63 60 86 81 91 92 77 72 79 75 84 81 60 57 75 70 78 77
(1-Show a frequency distribution of the final grades in mathematics & Statistics of 30 students are recorded in the accompanying table . Stat. Math. Stat. Math. Stat. Math. Stat. Math. Stat. Math. 50 55 80 75 53 50 57 90 76 71 70 72 68 72 65 73 75 93 93 81 80 62 65 85 86 90 92 64 67 61 60 83 82 56 52 74 72 94 96 82 85 63 60 86 81 91 92 77 72 79 75 84 81 60 57 75 70 78 77

Algebra & Trigonometry with Analytic Geometry
13th Edition
ISBN:9781133382119
Author:Swokowski
Publisher:Swokowski
Chapter10: Sequences, Series, And Probability
Section10.8: Probability
Problem 32E

Related questions
Topic Video
Question
Please I need help
⬇️⬇️⬇️⬇️
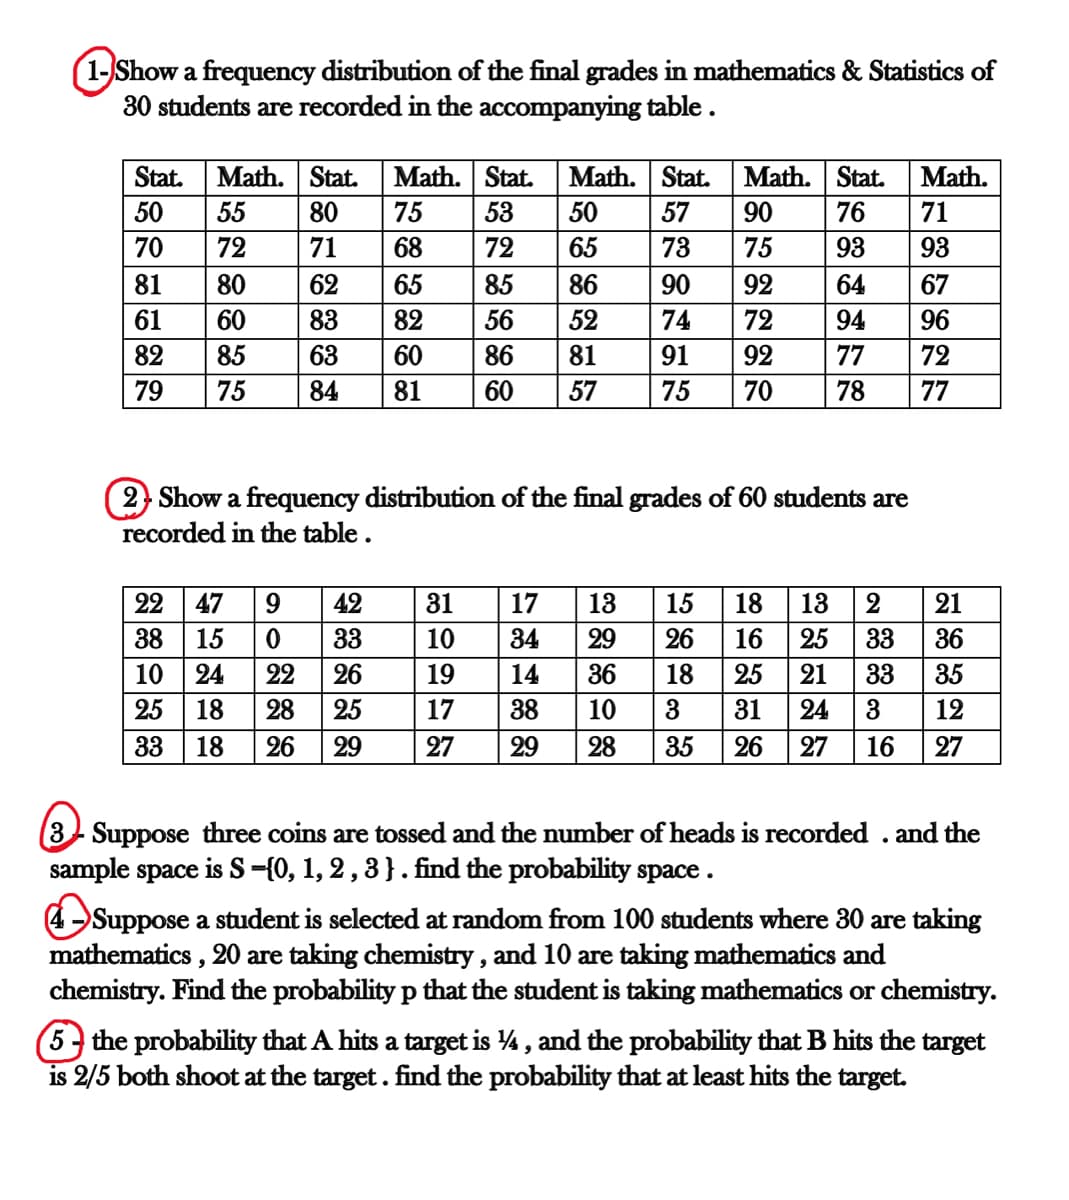
Transcribed Image Text:(1-Show a frequency distribution of the final grades in mathematics & Statistics of
30 students are recorded in the accompanying table .
Math. Stat.
Math. Stat.
Math. Stat.
57
Stat.
Math. Stat.
Math.
50
55
80
75
53
50
90
76
71
70
72
71
68
72
65
73
75
93
93
81
80
62
65
85
86
90
92
64
67
61
60
83
82
56
52
74
72
94
96
82
85
63
60
86
81
91
92
77
72
79
75
84
81
60
57
75
70
78
77
2 Show a frequency distribution of the final grades of 60 students are
recorded in the table .
22
47
9
42
31
17
13
15
18
13
21
38
15
33
10
34
29
26
16
25
33
36
10
24
22
26
19
14
36
18
25
21
33
35
25
18
28
25
17
38
10
3
31
24
3
12
33
18
26
29
27
29
28
35
26
27
16
27
8- Suppose three coins are tossed and the number of heads is recorded . and the
sample space is S={0, 1, 2 , 3 } . find the probability space.
4 Suppose a student is selected at random from 100 students where 30 are taking
mathematics , 20 are taking chemistry , and 10 are taking mathematics and
chemistry. Find the probability p that the student is taking mathematics or chemistry.
(5 the probability that A hits a target is 4, and the probability that B hits the target
is 2/5 both shoot at the target. find the probability that at least hits the target.
Expert Solution
This question has been solved!
Explore an expertly crafted, step-by-step solution for a thorough understanding of key concepts.

Step by step
Solved in 3 steps

Knowledge Booster


Learn more about
Need a deep-dive on the concept behind this application? Look no further. Learn more about this topic, statistics and related others by exploring similar questions and additional content below.Recommended textbooks for you
Algebra & Trigonometry with Analytic Geometry
Algebra
ISBN:
9781133382119
Author:
Swokowski
Publisher:
Cengage
Algebra & Trigonometry with Analytic Geometry
Algebra
ISBN:
9781133382119
Author:
Swokowski
Publisher:
Cengage