1. The table below lists the ages of the U.S. president at their inauguration. 57 61 57 57 57 61 50 47 55 55 54 46 54 58 54 68 51 49 64 50 48 65 52 56 46 56 55 51 54 49 42 51 54 51 60 62 43 55 56 61 52 69 64 47 70 78 (a) Construct a frequency distribution for the inauguration ages with a first class of 40-44 and equal class widths for each class after. (b) Draw a histogram for the inauguration ages. (c) Describe the shape of the histogram.
1. The table below lists the ages of the U.S. president at their inauguration. 57 61 57 57 57 61 50 47 55 55 54 46 54 58 54 68 51 49 64 50 48 65 52 56 46 56 55 51 54 49 42 51 54 51 60 62 43 55 56 61 52 69 64 47 70 78 (a) Construct a frequency distribution for the inauguration ages with a first class of 40-44 and equal class widths for each class after. (b) Draw a histogram for the inauguration ages. (c) Describe the shape of the histogram.

Glencoe Algebra 1, Student Edition, 9780079039897, 0079039898, 2018
18th Edition
ISBN:9780079039897
Author:Carter
Publisher:Carter
Chapter10: Statistics
Section10.6: Summarizing Categorical Data
Problem 4BGP

Related questions
Question
Transcribed Image Text:(20.2 KB)
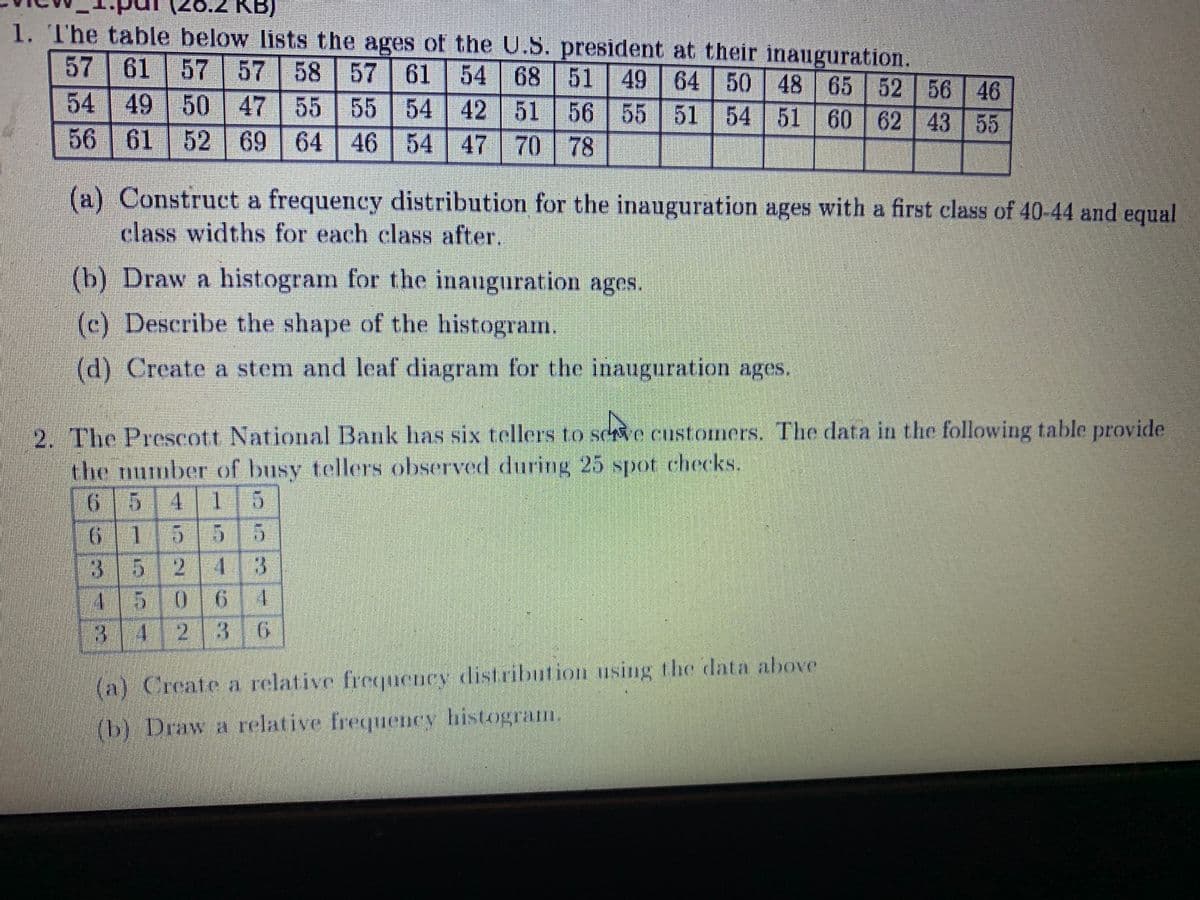
1. The table below lists the ages of the U.S. president at their inauguration.
57 61
57 57 58 57 61 54 68 51 49 64
50 48 | 46
65 52 56
54 51 60 62 43 55
54 49 50 47 55 55 | 54 42 51 56 55 51
56 61 52 69 64 46 54 47 70 | 78
(a) Construct a frequency distribution for the inauguration ages with a first class of 40-44 and equal
class widths for each class after.
(b) Draw a histogram for the inauguration ages.
(c) Describe the shape of the histogram.
(d) Create a stem and leaf diagram for the inauguration ages.
2. The Prescott National Bank has six tellers to sce customers. The data in the following table provide
the mumber of busy tellers observed during 25 spot checks.
65415
9.
6 115
5121413
3.
15-06
31412
1.
(a) Create a relative freqiuency distribuit ion using the data above
(b) Draw a relative frequency histogram.
Expert Solution
Step 1
Note : We’ll answer the first question since the exact one wasn’t specified. Please submit a new question specifying the one you’d like answered.
a) It is given that first class should be 40-44 and after this class, remaining classes should have equal width.
Therefore remaining classes should be like 44-48,48-52,52-56,...,76-80
Frequency distribution table:
| Class | Frequency |
| 40-44 | 2 |
| 44-48 | 4 |
| 48-52 | 8 |
| 52-56 | 11 |
| 56-60 | 8 |
| 60-64 | 5 |
| 64-68 | 3 |
| 68-72 | 4 |
| 72-76 | 0 |
| 76-80 | 1 |

Trending now
This is a popular solution!

Step by step
Solved in 3 steps with 1 images

Knowledge Booster


Learn more about
Need a deep-dive on the concept behind this application? Look no further. Learn more about this topic, statistics and related others by exploring similar questions and additional content below.Recommended textbooks for you
Glencoe Algebra 1, Student Edition, 9780079039897…
Algebra
ISBN:
9780079039897
Author:
Carter
Publisher:
McGraw Hill
Glencoe Algebra 1, Student Edition, 9780079039897…
Algebra
ISBN:
9780079039897
Author:
Carter
Publisher:
McGraw Hill