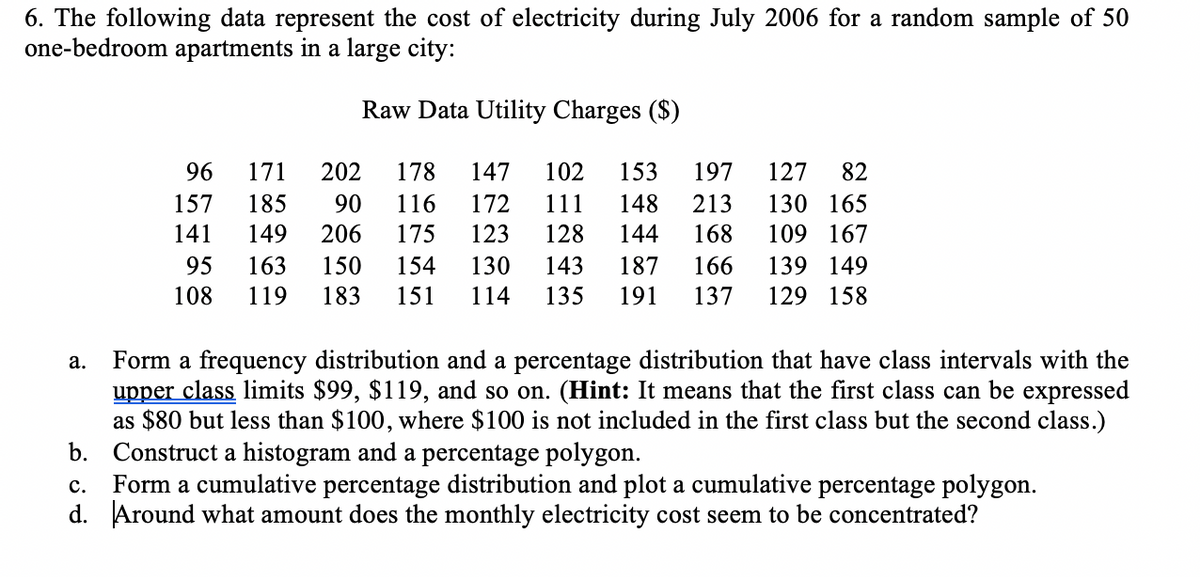
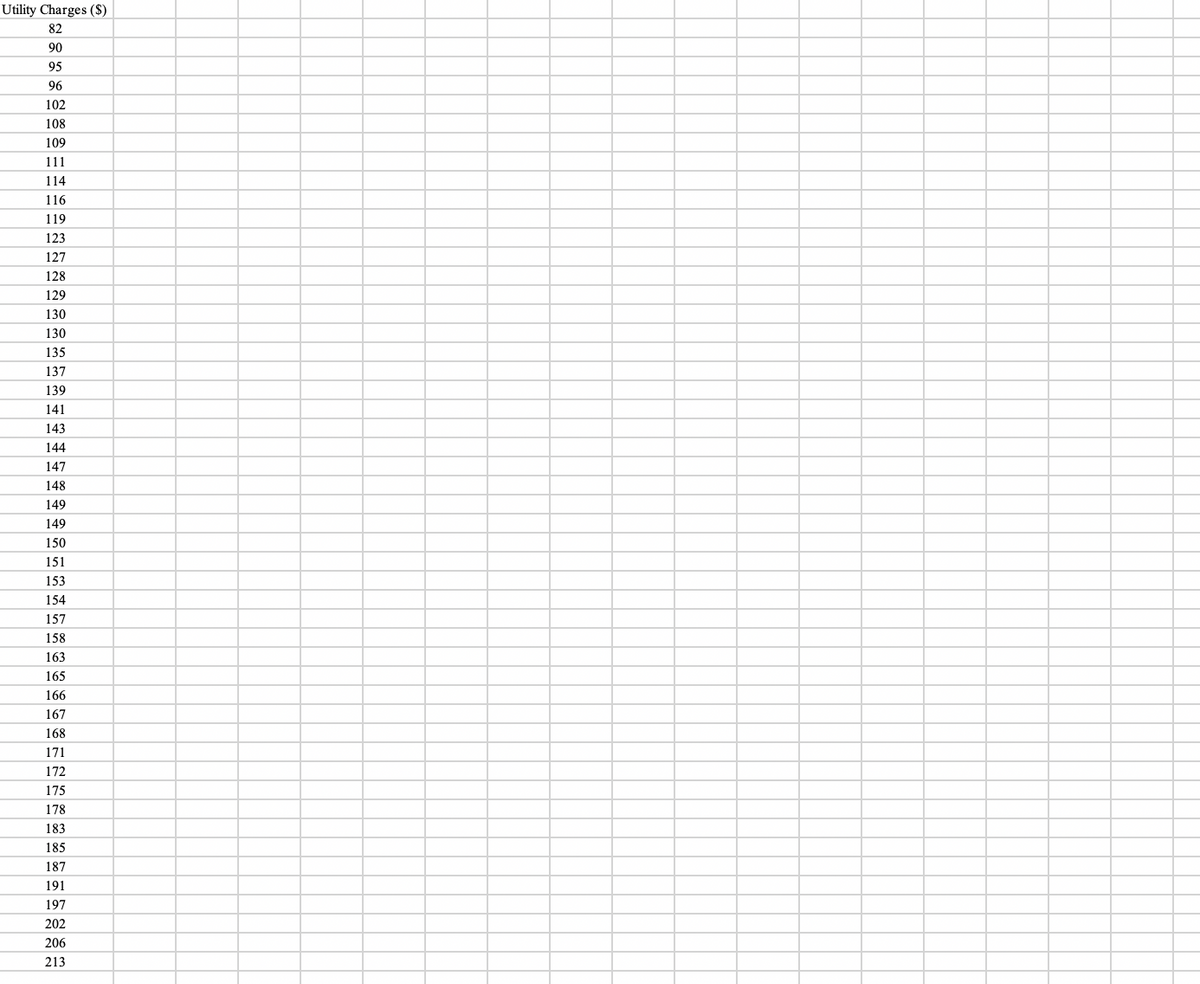
The following data represent the cost of electricity during July 2006 for a random sample of 50 one-bedroom apartments in a large city: Raw Data Utility Charges ($) 96 171 202 178 147 102 153 197 127 82 157 185 90 116 172 111 148 213 130 165 141 149 206 175 123 128 144 168 109 167 95 163 150 154 130 143 187 166 139 149 108 119 183 151 114 135 191 137 129 158 Form a frequency distribution and a percentage distribution that have class intervals with the upper class limits $99, $119, and so on. (Hint: It means that the first class can be expressed as $80 but less than $100, where $100 is not included in the first class but the second class.) Construct a histogram and a percentage polygon. Form a cumulative percentage distribution and plot a cumulative percentage polygon. Around what amount does the monthly electricity cost seem to be concentrated?


Inverse Normal Distribution
The method used for finding the corresponding z-critical value in a normal distribution using the known probability is said to be an inverse normal distribution. The inverse normal distribution is a continuous probability distribution with a family of two parameters.
Mean, Median, Mode
It is a descriptive summary of a data set. It can be defined by using some of the measures. The central tendencies do not provide information regarding individual data from the dataset. However, they give a summary of the data set. The central tendency or measure of central tendency is a central or typical value for a probability distribution.
Z-Scores
A z-score is a unit of measurement used in statistics to describe the position of a raw score in terms of its distance from the mean, measured with reference to standard deviation from the mean. Z-scores are useful in statistics because they allow comparison between two scores that belong to different normal distributions.
- The following data represent the cost of electricity during July 2006 for a random sample of 50 one-bedroom apartments in a large city:
Raw Data Utility Charges ($)
96 171 202 178 147 102 153 197 127 82
157 185 90 116 172 111 148 213 130 165
141 149 206 175 123 128 144 168 109 167
95 163 150 154 130 143 187 166 139 149
108 119 183 151 114 135 191 137 129 158
- Form a frequency distribution and a percentage distribution that have class intervals with the upper class limits $99, $119, and so on. (Hint: It means that the first class can be expressed as $80 but less than $100, where $100 is not included in the first class but the second class.)
- Construct a histogram and a percentage
polygon . - Form a cumulative percentage distribution and plot a cumulative percentage polygon.
- Around what amount does the monthly electricity cost seem to be concentrated?


Trending now
This is a popular solution!

Step by step
Solved in 3 steps with 4 images


