1 T 2 I 3 I. 4 .. Time 5 ..6 Data Set # Distance Distance in Velocity = Ad/t (m/s) Trial # Average Velocity (m/s) between meters (s) (?cm/100 =? m) use for calculations gates (cm) *add up all 3 trials/3 20 cm 0.2 m 0.599 0.33 0.31 m/s 1 0.696 0.29 0.634 0.32 3 40 cm 0.4 m 0.717 0.56 0.57 m/s 0.710 0.57 2 0.687 0.59 60 cm 0.6 m 0.701 0.86 0.85 m/s 1 0.726 0.83 2 0.702 0.85 80 cm 0.8 m 0.839 0.95 2.75 m/s 1 0.966 0.83 0.817 0.97 3 100 cm 1m 0.981 1.02 2.93 m/s 1 1.068 0.95 2 1.031 0.96 3
1 T 2 I 3 I. 4 .. Time 5 ..6 Data Set # Distance Distance in Velocity = Ad/t (m/s) Trial # Average Velocity (m/s) between meters (s) (?cm/100 =? m) use for calculations gates (cm) *add up all 3 trials/3 20 cm 0.2 m 0.599 0.33 0.31 m/s 1 0.696 0.29 0.634 0.32 3 40 cm 0.4 m 0.717 0.56 0.57 m/s 0.710 0.57 2 0.687 0.59 60 cm 0.6 m 0.701 0.86 0.85 m/s 1 0.726 0.83 2 0.702 0.85 80 cm 0.8 m 0.839 0.95 2.75 m/s 1 0.966 0.83 0.817 0.97 3 100 cm 1m 0.981 1.02 2.93 m/s 1 1.068 0.95 2 1.031 0.96 3

College Physics
1st Edition
ISBN:9781938168000
Author:Paul Peter Urone, Roger Hinrichs
Publisher:Paul Peter Urone, Roger Hinrichs
Chapter22: Magnetism
Section: Chapter Questions
Problem 77PE: Integrated Concepts (a) Using the values given for an MHD drive in Exercise 22.59, and assuming the...

Related questions
Question
I need help with these questions using the data
(Not honor class)
(Not grading)
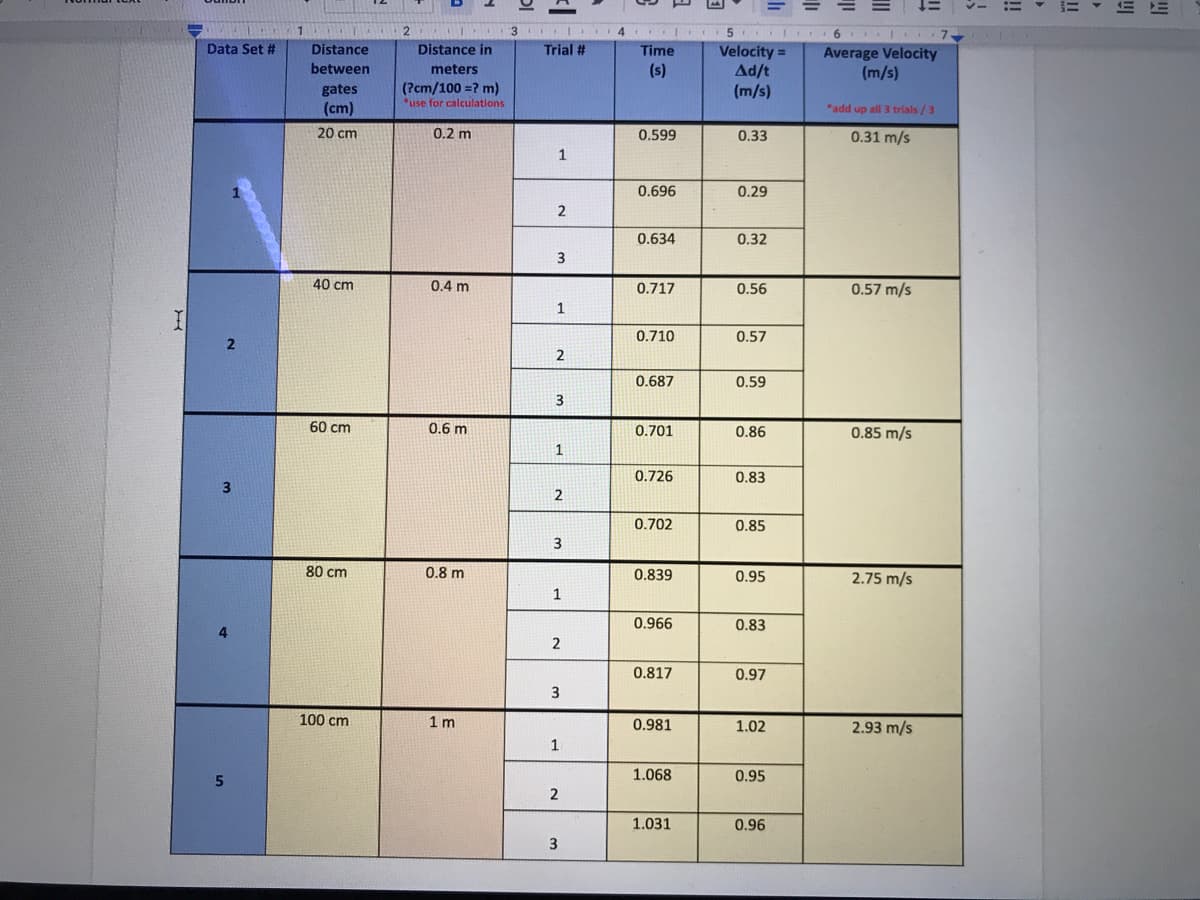
Transcribed Image Text:2 3 4
5 I 6 7
Data Set #
Distance
Distance in
Trial #
Velocity =
Ad/t
(m/s)
Time
Average Velocity
(m/s)
between
meters
(s)
gates
(cm)
(?cm/100 =? m)
*use for calculations
*add up all 3 trials /3
20 cm
0.2 m
0.599
0.33
0.31 m/s
1
0.696
0.29
0.634
0.32
3
40 cm
0.4 m
0.717
0.56
0.57 m/s
1
0.710
0.57
0.687
0.59
3
60 cm
0.6 m
0.701
0.86
0.85 m/s
1
0.726
0.83
2
0.702
0.85
3
80 cm
0.8 m
0.839
0.95
2.75 m/s
1
0.966
0.83
2
0.817
0.97
3
100 cm
1 m
0.981
1.02
2.93 m/s
1
1.068
0.95
2
1.031
0.96
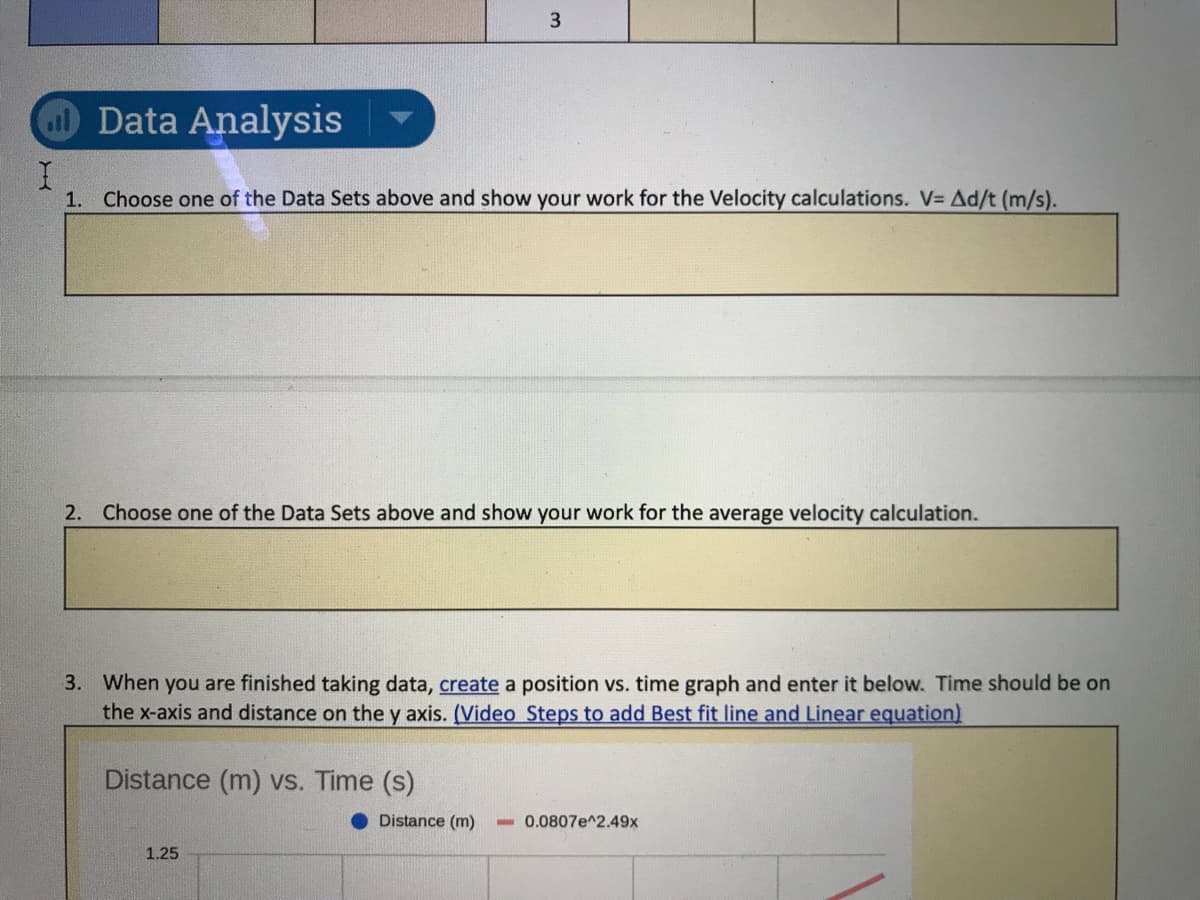
Transcribed Image Text:Data Analysis
1. Choose one of the Data Sets above and show your work for the Velocity calculations. V= Ad/t (m/s).
2. Choose one of the Data Sets above and show your work for the average velocity calculation.
3. When you are finished taking data, create a position vs. time graph and enter it below. Time should be on
the x-axis and distance on the y axis. (Video Steps to add Best fit line and Linear equation)
Distance (m) vs. Time (s)
Distance (m)
- 0.0807e^2.49x
1.25
3.
Expert Solution
This question has been solved!
Explore an expertly crafted, step-by-step solution for a thorough understanding of key concepts.

Step by step
Solved in 3 steps

Recommended textbooks for you
College Physics
Physics
ISBN:
9781938168000
Author:
Paul Peter Urone, Roger Hinrichs
Publisher:
OpenStax College


College Physics
Physics
ISBN:
9781938168000
Author:
Paul Peter Urone, Roger Hinrichs
Publisher:
OpenStax College

University Physics Volume 3
Physics
ISBN:
9781938168185
Author:
William Moebs, Jeff Sanny
Publisher:
OpenStax

Principles of Physics: A Calculus-Based Text
Physics
ISBN:
9781133104261
Author:
Raymond A. Serway, John W. Jewett
Publisher:
Cengage Learning

College Physics
Physics
ISBN:
9781305952300
Author:
Raymond A. Serway, Chris Vuille
Publisher:
Cengage Learning