1 tasted yogurt containing the extra calciur but without the added calcium. Both groups rated the flavor on a scale of 1 to 10, with 1 being "ve unpleasant" and 10 being "very pleasant." The mean rating for group 1 was x = 6.5 with a standard deviation of s = 1.5. The mean rating for group 2 was x2 = 7.0 with a standard deviation of s2 2.0 Let 4and 42 represent the mean ratings we would observe for the entire population represented by volunteers if all members of this population tasted, respectively, the yogurt with and without the ad calcium. Assuming the conditions for using t-procedures have been met, which of the following %3D represents a 90% confidence interval for # -42 (using a conservative value for the degrees of freedom)?
1 tasted yogurt containing the extra calciur but without the added calcium. Both groups rated the flavor on a scale of 1 to 10, with 1 being "ve unpleasant" and 10 being "very pleasant." The mean rating for group 1 was x = 6.5 with a standard deviation of s = 1.5. The mean rating for group 2 was x2 = 7.0 with a standard deviation of s2 2.0 Let 4and 42 represent the mean ratings we would observe for the entire population represented by volunteers if all members of this population tasted, respectively, the yogurt with and without the ad calcium. Assuming the conditions for using t-procedures have been met, which of the following %3D represents a 90% confidence interval for # -42 (using a conservative value for the degrees of freedom)?

MATLAB: An Introduction with Applications
6th Edition
ISBN:9781119256830
Author:Amos Gilat
Publisher:Amos Gilat
Chapter1: Starting With Matlab
Section: Chapter Questions
Problem 1P

Related questions
Topic Video
Question
Transcribed Image Text:1378748/quizzes/3108870/take/questions/24648531
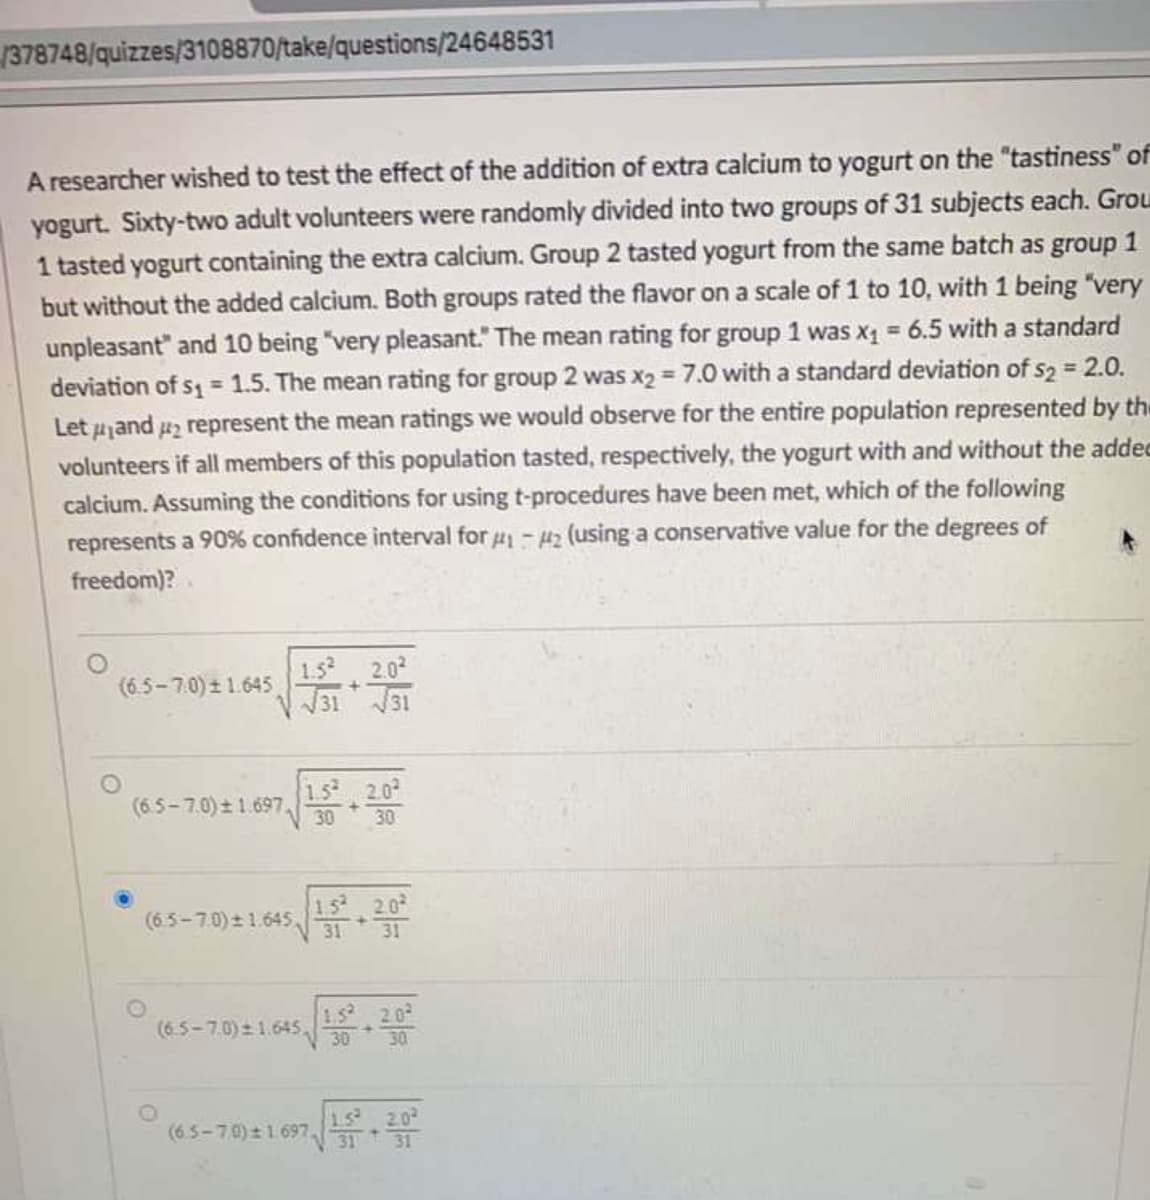
A researcher wished to test the effect of the addition of extra calcium to yogurt on the "tastiness" of
yogurt. Sixty-two adult volunteers were randomly divided into two groups of 31 subjects each. Grou
1 tasted yogurt containing the extra calcium. Group 2 tasted yogurt from the same batch as group 1
but without the added calcium. Both groups rated the flavor on a scale of 1 to 10, with 1 being "very
unpleasant" and 10 being "very pleasant." The mean rating for group 1 was x 6.5 with a standard
deviation of s = 1.5. The mean rating for group 2 was x2 = 7.0 with a standard deviation of s2 = 2.0.
Let 4jand 42 represent the mean ratings we would observe for the entire population represented by th
volunteers if all members of this population tasted, respectively, the yogurt with and without the addec
calcium. Assuming the conditions for using t-procedures have been met, which of the following
represents a 90% confidence interval for 4- uz (using a conservative value for the degrees of
freedom)?
(6.5-7.0) ± 1.645
1.5
2.0
31 31
1.5 2.0
(6.5-7.0)± 1.697,
30
30
(6.5-7.0) 1.645,
15 2.0
31
31
(6.5-7.0) 1.645,
1.5 20
30
30
(6.5-70) ± 1697
15 2.0
31
Expert Solution
This question has been solved!
Explore an expertly crafted, step-by-step solution for a thorough understanding of key concepts.

This is a popular solution!

Trending now
This is a popular solution!

Step by step
Solved in 2 steps with 2 images

Knowledge Booster


Learn more about
Need a deep-dive on the concept behind this application? Look no further. Learn more about this topic, statistics and related others by exploring similar questions and additional content below.Recommended textbooks for you
MATLAB: An Introduction with Applications
Statistics
ISBN:
9781119256830
Author:
Amos Gilat
Publisher:
John Wiley & Sons Inc

Probability and Statistics for Engineering and th…
Statistics
ISBN:
9781305251809
Author:
Jay L. Devore
Publisher:
Cengage Learning

Statistics for The Behavioral Sciences (MindTap C…
Statistics
ISBN:
9781305504912
Author:
Frederick J Gravetter, Larry B. Wallnau
Publisher:
Cengage Learning
MATLAB: An Introduction with Applications
Statistics
ISBN:
9781119256830
Author:
Amos Gilat
Publisher:
John Wiley & Sons Inc
Probability and Statistics for Engineering and th…
Statistics
ISBN:
9781305251809
Author:
Jay L. Devore
Publisher:
Cengage Learning
Statistics for The Behavioral Sciences (MindTap C…
Statistics
ISBN:
9781305504912
Author:
Frederick J Gravetter, Larry B. Wallnau
Publisher:
Cengage Learning

Elementary Statistics: Picturing the World (7th E…
Statistics
ISBN:
9780134683416
Author:
Ron Larson, Betsy Farber
Publisher:
PEARSON

The Basic Practice of Statistics
Statistics
ISBN:
9781319042578
Author:
David S. Moore, William I. Notz, Michael A. Fligner
Publisher:
W. H. Freeman

Introduction to the Practice of Statistics
Statistics
ISBN:
9781319013387
Author:
David S. Moore, George P. McCabe, Bruce A. Craig
Publisher:
W. H. Freeman