c) Your Components division manufactures capacitors, and the mean capacitance of 400 capacitors you have selected is 100µF, with a standard deviation of 7uF. If the capacitances are normally distributed, determine the number of capacitors likely to have values between 90pF and 110µF. Note: Use the z-table given in Appendix A when answering part c. d) A colleague, who is a Fuels engineer, is testing the effects of an experimental fuel additive for petrol engines which your company is developing. She adds the same sample amount of additive to 100 full petrol tanks for the same model of car, and records the number of miles per gallon (mpg) for each car after being driven around a test track at a constant speed, until the fuel runs out. She knows that such testing undertaken without the additive produces a mean mpg figure of 44. Collecting results with the additive, she notices that the mean mpg figure is 48 with a sample standard deviation of 13 mpg. By interpreting the results of the testing, show whether you agree, or not, with her hypothesis that the fuel additive has ifluenced the number of miles per gallon for the cars. Draw by hand, or use suitable software, to produce a graphic, suitable for a non-technical company executive, which represents the results of your analysis.
c) Your Components division manufactures capacitors, and the mean capacitance of 400 capacitors you have selected is 100µF, with a standard deviation of 7uF. If the capacitances are normally distributed, determine the number of capacitors likely to have values between 90pF and 110µF. Note: Use the z-table given in Appendix A when answering part c. d) A colleague, who is a Fuels engineer, is testing the effects of an experimental fuel additive for petrol engines which your company is developing. She adds the same sample amount of additive to 100 full petrol tanks for the same model of car, and records the number of miles per gallon (mpg) for each car after being driven around a test track at a constant speed, until the fuel runs out. She knows that such testing undertaken without the additive produces a mean mpg figure of 44. Collecting results with the additive, she notices that the mean mpg figure is 48 with a sample standard deviation of 13 mpg. By interpreting the results of the testing, show whether you agree, or not, with her hypothesis that the fuel additive has ifluenced the number of miles per gallon for the cars. Draw by hand, or use suitable software, to produce a graphic, suitable for a non-technical company executive, which represents the results of your analysis.

MATLAB: An Introduction with Applications
6th Edition
ISBN:9781119256830
Author:Amos Gilat
Publisher:Amos Gilat
Chapter1: Starting With Matlab
Section: Chapter Questions
Problem 1P

Related questions
Question
part C D
i need in words not handwritten
Transcribed Image Text:Scenario:
You work as a Test Engineer for a global manufacturer of electrical and mechanical components and
systems. Your Line Manager is responsible for delegating to you and your colleagues the testing of theory,
principles, and hypotheses from several worldwide company divisions. She has asked you to undertake a
series of such evaluations.
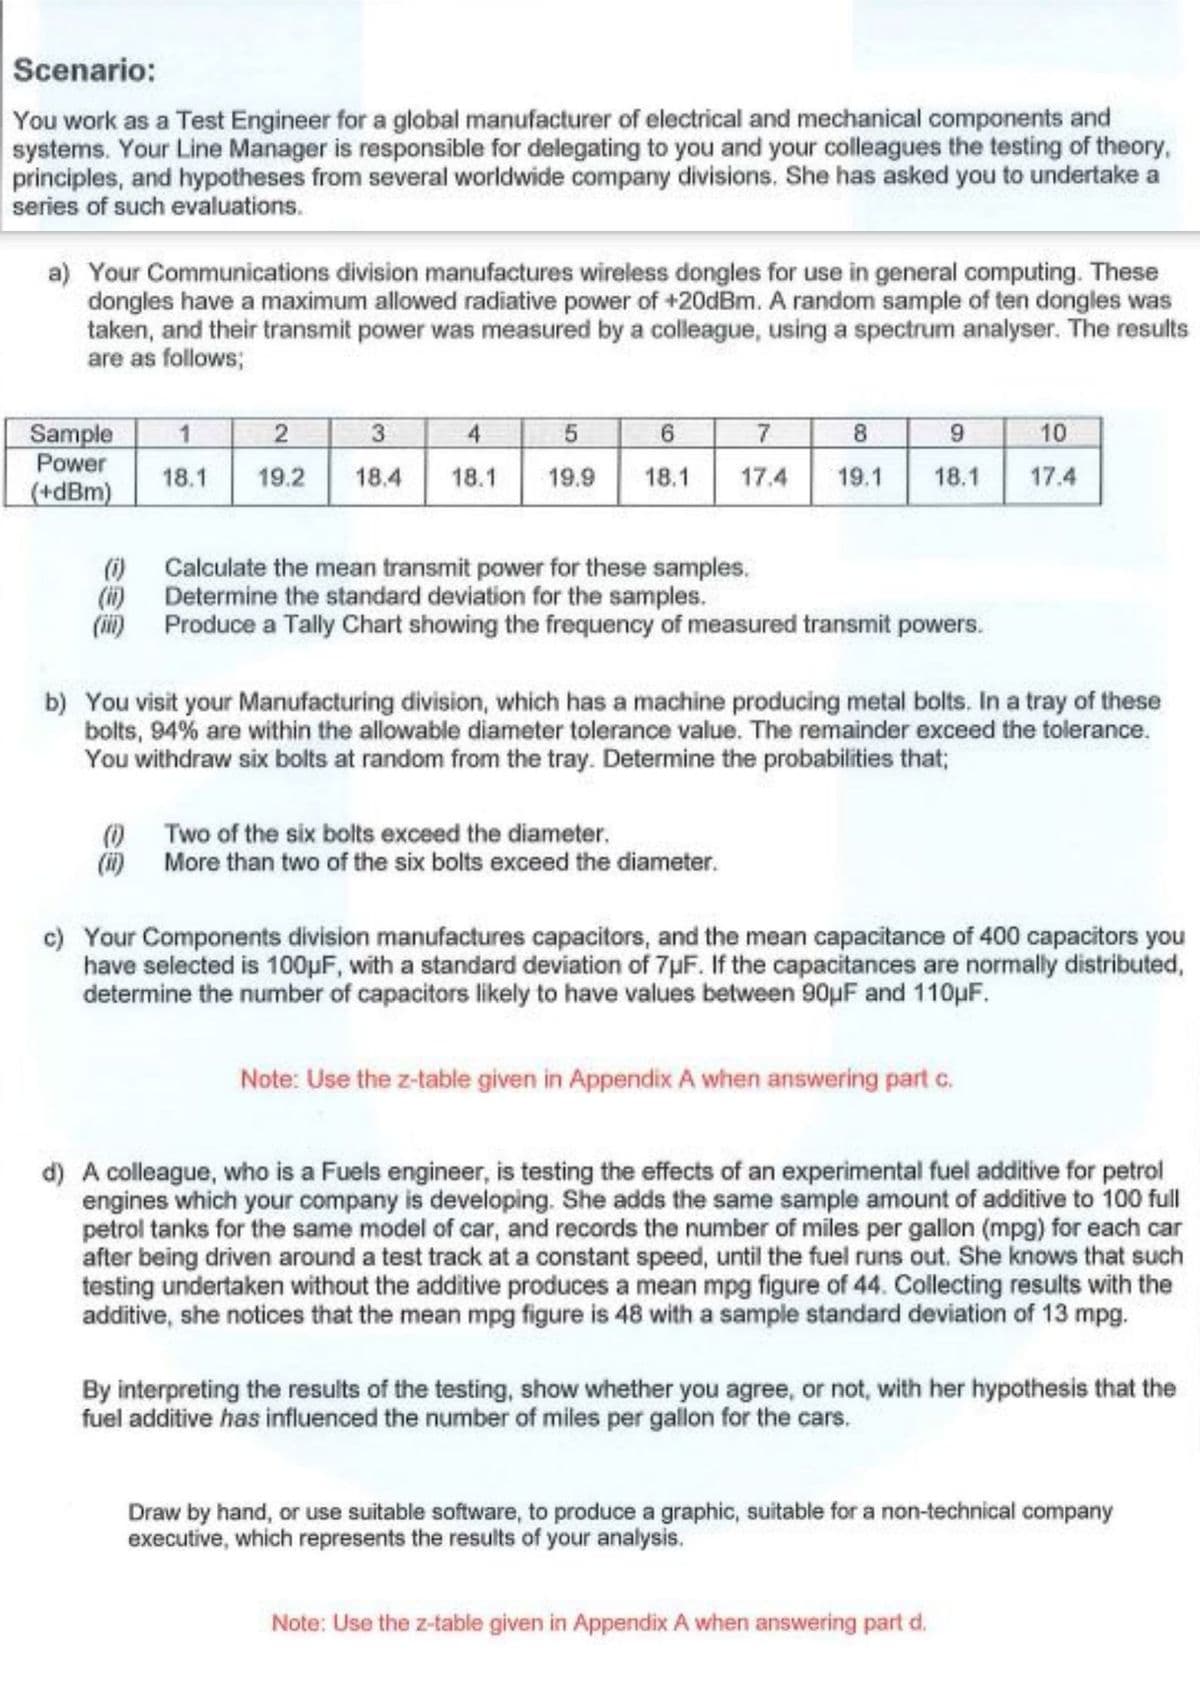
a) Your Communications division manufactures wireless dongles for use in general computing. These
dongles have a maximum allowed radiative power of +20dBm. A random sample of ten dongles was
taken, and their transmit power was measured by a colleague, using a spectrum analyser. The results
are as follows;
10
Sample
Power
(+dBm)
2
3
4
5
6.
8
18.1
19.2
18.4
18.1
19.9
18.1
17.4
19.1
18.1
17.4
() Calculate the mean transmit power for these samples.
(i) Determine the standard deviation for the samples.
(ii) Produce a Tally Chart showing the frequency of measured transmit powers.
b) You visit your Manufacturing division, which has a machine producing metal bolts. In a tray of these
bolts, 94% are within the allowable diameter tolerance value. The remainder exceed the tolerance.
You withdraw six bolts at random from the tray. Determine the probabilities that;
(0)
Two of the six bolts exceed the diameter.
(i) More than two of the six bolts exceed the diameter.
c) Your Components division manufactures capacitors, and the mean capacitance of 400 capacitors you
have selected is 100µF, with a standard deviation of 7pF. If the capacitances are normally distributed,
determine the number of capacitors likely to have values between 90µF and 110µF.
Note: Use the z-table given in Appendix A when answering part c.
d) A colleague, who is a Fuels engineer, is testing the effects of an experimental fuel additive for petrol
engines which your company is developing. She adds the same sample amount of additive to 100 full
petrol tanks for the same model of car, and records the number of miles per gallon (mpg) for each car
after being driven around a test track at a constant speed, until the fuel runs out. She knows that such
testing undertaken without the additive produces a mean mpg figure of 44. Collecting results with the
additive, she notices that the mean mpg figure is 48 with a sample standard deviation of 13 mpg.
By interpreting the results of the testing, show whether you agree, or not, with her hypothesis that the
fuel additive has influenced the number of miles per gallon for the cars.
Draw by hand, or use suitable software, to produce a graphic, suitable for a non-technical company
executive, which represents the results of your analysis.
Note: Use the z-table given in Appendix A when answering part d.
Expert Solution
This question has been solved!
Explore an expertly crafted, step-by-step solution for a thorough understanding of key concepts.

This is a popular solution!

Trending now
This is a popular solution!

Step by step
Solved in 4 steps

Recommended textbooks for you
MATLAB: An Introduction with Applications
Statistics
ISBN:
9781119256830
Author:
Amos Gilat
Publisher:
John Wiley & Sons Inc

Probability and Statistics for Engineering and th…
Statistics
ISBN:
9781305251809
Author:
Jay L. Devore
Publisher:
Cengage Learning

Statistics for The Behavioral Sciences (MindTap C…
Statistics
ISBN:
9781305504912
Author:
Frederick J Gravetter, Larry B. Wallnau
Publisher:
Cengage Learning
MATLAB: An Introduction with Applications
Statistics
ISBN:
9781119256830
Author:
Amos Gilat
Publisher:
John Wiley & Sons Inc
Probability and Statistics for Engineering and th…
Statistics
ISBN:
9781305251809
Author:
Jay L. Devore
Publisher:
Cengage Learning
Statistics for The Behavioral Sciences (MindTap C…
Statistics
ISBN:
9781305504912
Author:
Frederick J Gravetter, Larry B. Wallnau
Publisher:
Cengage Learning

Elementary Statistics: Picturing the World (7th E…
Statistics
ISBN:
9780134683416
Author:
Ron Larson, Betsy Farber
Publisher:
PEARSON

The Basic Practice of Statistics
Statistics
ISBN:
9781319042578
Author:
David S. Moore, William I. Notz, Michael A. Fligner
Publisher:
W. H. Freeman

Introduction to the Practice of Statistics
Statistics
ISBN:
9781319013387
Author:
David S. Moore, George P. McCabe, Bruce A. Craig
Publisher:
W. H. Freeman