The following data are the Medical Expenses in each of the 50 states. Using descriptive statistics, measures of central tendency, and measures of dispersion, answer the following questions below. The data is in thousands of dollars and is arranged in alphabetical order Q 1: Determine the Relative Frequency of the fourth class Write the result as follows (0 .XX) Q 2: Determine the Relative Frequency of the fifth class. Write the result as follows (0 .XX) Q 3: Determine the Cumulative Relative Frequency of the fifth class. Write the result as follows (0 .XX)


Inverse Normal Distribution
The method used for finding the corresponding z-critical value in a normal distribution using the known probability is said to be an inverse normal distribution. The inverse normal distribution is a continuous probability distribution with a family of two parameters.
Mean, Median, Mode
It is a descriptive summary of a data set. It can be defined by using some of the measures. The central tendencies do not provide information regarding individual data from the dataset. However, they give a summary of the data set. The central tendency or measure of central tendency is a central or typical value for a probability distribution.
Z-Scores
A z-score is a unit of measurement used in statistics to describe the position of a raw score in terms of its distance from the mean, measured with reference to standard deviation from the mean. Z-scores are useful in statistics because they allow comparison between two scores that belong to different normal distributions.
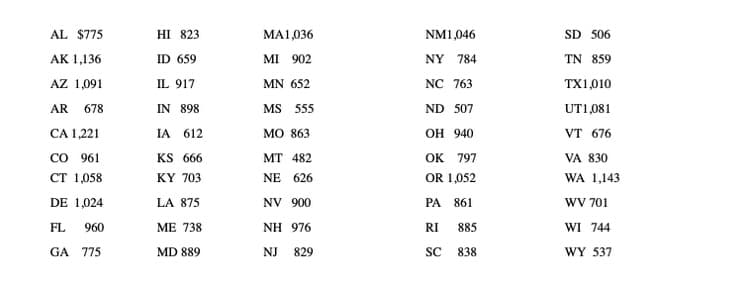
The following data are the Medical Expenses in each of the 50 states.
Using
The data is in thousands of dollars and is arranged in alphabetical order
Q 1: Determine the Relative Frequency of the fourth class Write the result as follows (0 .XX)
Q 2: Determine the Relative Frequency of the fifth class. Write the result as follows (0 .XX)
Q 3: Determine the Cumulative Relative Frequency of the fifth class. Write the result as follows (0 .XX)
Q 4: The value (Bar Height) of the Histogram of the last class is
Q 5: The value of the
Write the number only, do not use symbols
Q 6: The value of the Warhead of the fifth class in percent is
Write the number only, do not use symbols
Q 7: Determine the average (Average) of the data. Write the result as follows (XXX .X)
Q 8: Find the median of the data. Write the result as follows (XXX .X)
Q 9: Determine the
Q 10: Determine the standard deviation of the data. Write the result as follows (XXX .X)
Q 11: Determine the amount of medical expenses of the first class. Use numbers only do not use symbols
Q 12: From the previous answer. Find the standard deviation of the first class medical expenses. Write the result as follows (XX .X)
Note:
Hi there! Thank you for posting the question. As your question has more than 3 parts, we have solved only the first three subparts for you. If you need any specific subpart to be answered, please re-submit the question by specifying the subpart number or name.
(1). Determine the relative frequency of the fourth class:
Frequency distribution:
The number of values lying in the particular interval or the number of times each value repeats is the frequency of that particular class interval or event. The frequencies are calculated by using the tally mark.
The data represents the medical expenses in each of the 50 states.
The data has to be arranged in ascending order.
The minimum and maximum values of the dataset are 482 and 1221.
Here, the number of data values that falls under the specified interval is the frequency of that particular class interval.
Procedure for constructing the frequency distribution:
Step by step procedure for constructing the frequency distribution is given below:
- The first lower bound should be the minimum value or a number smaller than the minimum value of the variable “medical expenses”. That is, the first lower bound should be 482 (or) less.
- The number of values of medical expenses falls under the specified interval is the frequency of that particular class interval of medical expenses.
- Find the class width as (maximum value – minimum value)/ number of classes.
- Add the class width to the lower limit of the first class to get lower limit of the second class. Keep on doing this until the lower limit of the last class is obtained.
- Now, subtract 1 from class width and add the result to the lower limit of the first class to get upper limit of the first class. Continue the same procedure to find upper limits of all class.
The number of classes is obtained as given below:
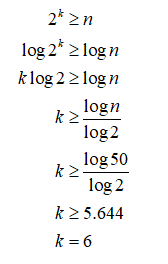
Thus, the number of classes is 6.
The class width is obtained as given below:
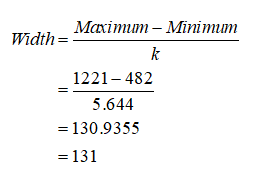
Thus, the class width is 131.
Consider the first lowest class interval as 482.
Hence, the lower limits of the class intervals with minimum value as first lower limit are: 482, 613, 744, 875, 1006, 1137. and the upper limits of the class intervals are obtained by adding 130 to lower limits as: 612, 743, 874, 1005, 1136 and 1267.
The number of values in between the class interval 482 -612 is 6.
Therefore, the frequency of the class interval 482 -612 is 6.
Similarly, the frequencies of all the remaining class intervals have to be calculated.
The frequency distribution for the dataset of medical expenses is obtained from the calculation given below:
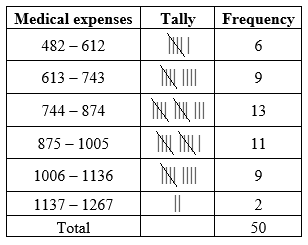
The relative frequency of the fourth class is obtained as given below:
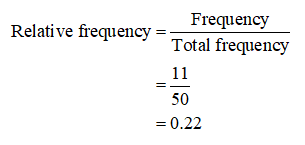
Thus, the relative frequency of the fourth class is 0.22.

Step by step
Solved in 2 steps with 6 images


