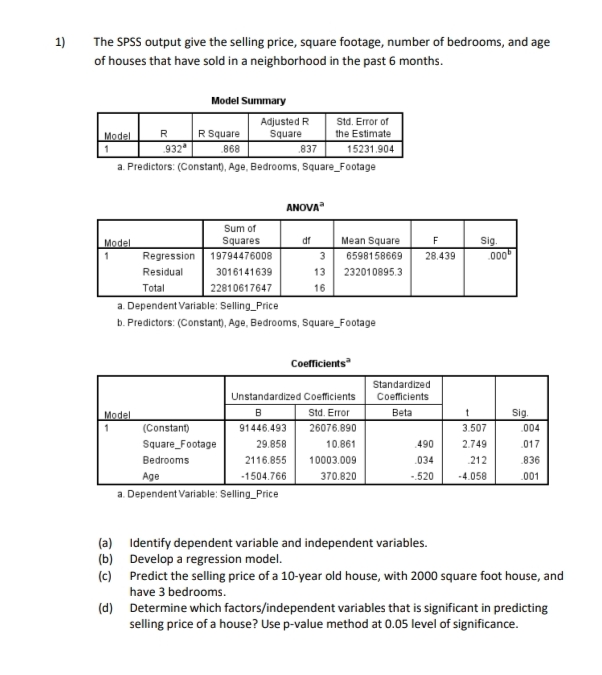
1) The SPSS output give the selling price, square footage, number of bedrooms, and age of houses that have sold in a neighborhood in the past 6 months. Model Summary Adjusted R Std. Error of R Square Square 868 a. Predictors: (Constant), Age, Bedrooms, Square_Footage Model. R 932 the Estimate 837 15231.904 ANOVA Sum of Squares Mean Square 6598158669 13 232010895.3 df F Sig 000 Model Regression 19794476008 3. 28.439 Residual 3016141639 Total a. Dependent Variable: Selling_Price b. Predictors: (Constant), Age, Bedrooms, Square_Footage 22810617647 16 Coeficients Standardized Coeficients Model (Constant Unstandardized Coefmicients Std. Error 26076.890 Beta Sig 91446.493 3.507 .004 Square_Footage 29.858 10.861 490 2.749 017 Bedrooms 2116.855 10003.009 034 212 836 -1504.766 370.820 520 4.058 001 Age a. Dependent Variable: Selling_Price (a) Identify dependent variable and independent variables. (b) Develop a regression model. (c) Predict the selling price of a 10-year old house, with 2000 square foot house, an have 3 bedrooms. (d) Determine which factors/independent variables that is significant in predicting selling price of a house? Use p-value method at 0.05 level of significance.


Minimization
In mathematics, traditional optimization problems are typically expressed in terms of minimization. When we talk about minimizing or maximizing a function, we refer to the maximum and minimum possible values of that function. This can be expressed in terms of global or local range. The definition of minimization in the thesaurus is the process of reducing something to a small amount, value, or position. Minimization (noun) is an instance of belittling or disparagement.
Maxima and Minima
The extreme points of a function are the maximum and the minimum points of the function. A maximum is attained when the function takes the maximum value and a minimum is attained when the function takes the minimum value.
Derivatives
A derivative means a change. Geometrically it can be represented as a line with some steepness. Imagine climbing a mountain which is very steep and 500 meters high. Is it easier to climb? Definitely not! Suppose walking on the road for 500 meters. Which one would be easier? Walking on the road would be much easier than climbing a mountain.
Concavity
In calculus, concavity is a descriptor of mathematics that tells about the shape of the graph. It is the parameter that helps to estimate the maximum and minimum value of any of the functions and the concave nature using the graphical method. We use the first derivative test and second derivative test to understand the concave behavior of the function.


Trending now
This is a popular solution!

Step by step
Solved in 2 steps with 1 images


