1. 50 Companies percentages of revenues spent on R&D are given below. 5.2 6.9 7.8 8.8 10.5 10.5 5.6 6.9 7.9 5.9 7.1 8. 9.2 10.6 6. 7.1 8. 9.4 11.1 6.5 7.2 8.1 9.5 11.3 6.5 7.2 8.2 9.5 11.7 6.5 7.5 8.2 9.6 12.0 13.2 13.5 13.5 6.6 7.5 8.2 9.7 6.8 7.7 8.4 9.9 6.9 7.7 8.5 10.1 Find the following • Mean = • Range= • Lower Quartile= • Inter Quartile Range= • Standard Deviation= Median= Mode= Variance= Upper Quartile= First SD interval, Number of data % of data II I| ||
1. 50 Companies percentages of revenues spent on R&D are given below. 5.2 6.9 7.8 8.8 10.5 10.5 5.6 6.9 7.9 5.9 7.1 8. 9.2 10.6 6. 7.1 8. 9.4 11.1 6.5 7.2 8.1 9.5 11.3 6.5 7.2 8.2 9.5 11.7 6.5 7.5 8.2 9.6 12.0 13.2 13.5 13.5 6.6 7.5 8.2 9.7 6.8 7.7 8.4 9.9 6.9 7.7 8.5 10.1 Find the following • Mean = • Range= • Lower Quartile= • Inter Quartile Range= • Standard Deviation= Median= Mode= Variance= Upper Quartile= First SD interval, Number of data % of data II I| ||

Holt Mcdougal Larson Pre-algebra: Student Edition 2012
1st Edition
ISBN:9780547587776
Author:HOLT MCDOUGAL
Publisher:HOLT MCDOUGAL
Chapter7: Percents
Section7.2: Percents And Proportions
Problem 18E

Related questions
Topic Video
Question
100%
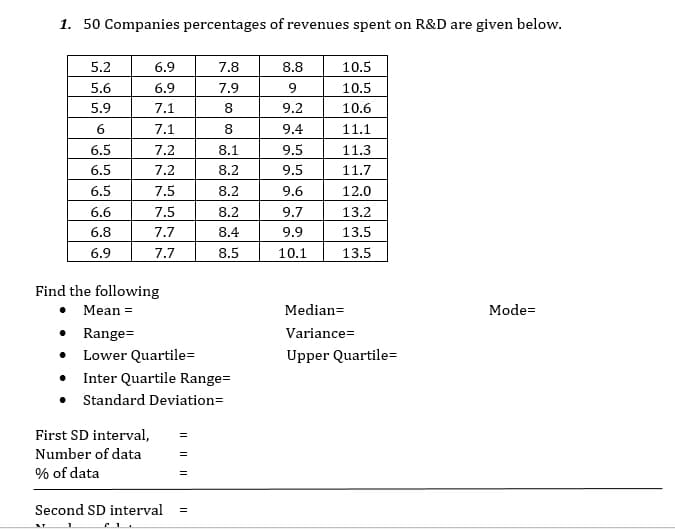
Transcribed Image Text:1. 50 Companies percentages of revenues spent on R&D are given below.
5.2
6.9
7.8
8.8
10.5
5.6
6.9
7.9
9
10.5
5.9
7.1
8
9.2
10.6
7.1
8
9.4
11.1
6.5
7.2
8.1
9.5
11.3
6.5
7.2
8.2
9.5
11.7
6.5
7.5
8.2
9.6
12.0
6.6
7.5
8.2
9.7
13.2
6.8
7.7
8.4
9.9
13.5
6.9
7.7
8.5
10.1
13.5
Find the following
• Mean =
• Range=
• Lower Quartile=
Median=
Mode=
Variance=
Upper Quartile=
Inter Quartile Range=
• Standard Deviation=
First SD interval,
Number of data
% of data
Second SD interval
Il || ||
Expert Solution
This question has been solved!
Explore an expertly crafted, step-by-step solution for a thorough understanding of key concepts.

Step by step
Solved in 5 steps

Knowledge Booster


Learn more about
Need a deep-dive on the concept behind this application? Look no further. Learn more about this topic, statistics and related others by exploring similar questions and additional content below.Recommended textbooks for you
Holt Mcdougal Larson Pre-algebra: Student Edition…
Algebra
ISBN:
9780547587776
Author:
HOLT MCDOUGAL
Publisher:
HOLT MCDOUGAL
Holt Mcdougal Larson Pre-algebra: Student Edition…
Algebra
ISBN:
9780547587776
Author:
HOLT MCDOUGAL
Publisher:
HOLT MCDOUGAL