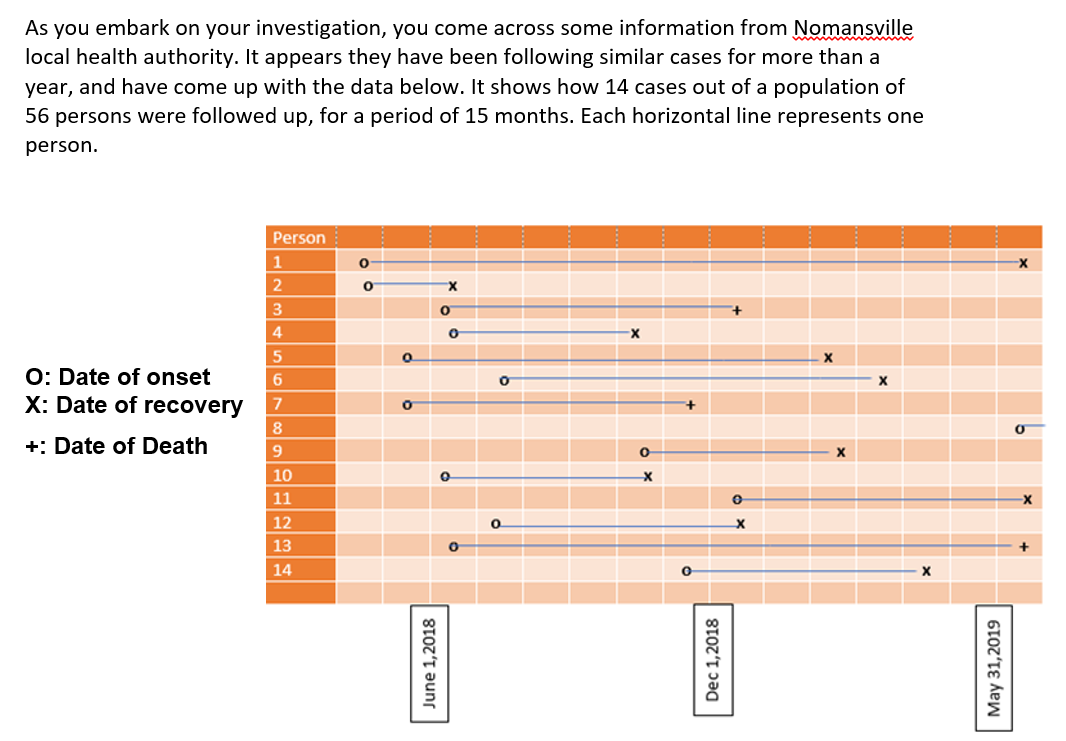
As you embark on your investigation, you come across some information from Nomansville local health authority. It appears they have been following similar cases for more than a year, and have come up with the data below. It shows how 14 cases out of a population of 56 persons were followed up, for a period of 15 months. Each horizontal line represents one person. Person 1 2 3 O: Date of onset X: Date of recovery 7 +: Date of Death 9. 10 11 12 13 14 June 1,2018 Dec 1,2018 May 31,2019


Inverse Normal Distribution
The method used for finding the corresponding z-critical value in a normal distribution using the known probability is said to be an inverse normal distribution. The inverse normal distribution is a continuous probability distribution with a family of two parameters.
Mean, Median, Mode
It is a descriptive summary of a data set. It can be defined by using some of the measures. The central tendencies do not provide information regarding individual data from the dataset. However, they give a summary of the data set. The central tendency or measure of central tendency is a central or typical value for a probability distribution.
Z-Scores
A z-score is a unit of measurement used in statistics to describe the position of a raw score in terms of its distance from the mean, measured with reference to standard deviation from the mean. Z-scores are useful in statistics because they allow comparison between two scores that belong to different normal distributions.
1. Calculate the incidence rate from June 1, 2018 to May 31, 2019 using the midpoint population as the denominator. Express your answer as a percentage.
2. Calculate the point prevalence on December 1, 2018. Express your answer as a percentage.
3. Calculate the period prevalence from June 1, 2018 to May 31, 2019. Express your answer as a percentage.

Step by step
Solved in 2 steps with 1 images


