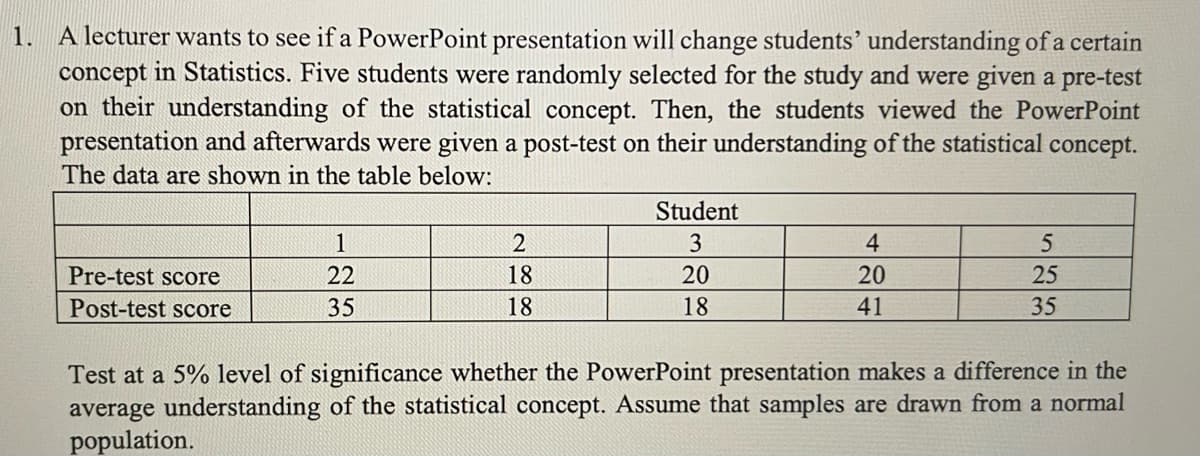
1. A lecturer wants to see if a PowerPoint presentation will change students' understanding of a certain concept in Statistics. Five students were randomly selected for the study and were given a pre-test on their understanding of the statistical concept. Then, the students viewed the PowerPoint presentation and afterwards were given a post-test on their understanding of the statistical concept. The data are shown in the table below: Student 1 2 3 4 Pre-test score 22 18 20 20 25 Post-test score 35 18 18 41 35 Test at a 5% level of significance whether the PowerPoint presentation makes a difference in the average understanding of the statistical concept. Assume that samples are drawn from a normal population.
1. A lecturer wants to see if a PowerPoint presentation will change students' understanding of a certain concept in Statistics. Five students were randomly selected for the study and were given a pre-test on their understanding of the statistical concept. Then, the students viewed the PowerPoint presentation and afterwards were given a post-test on their understanding of the statistical concept. The data are shown in the table below: Student 1 2 3 4 Pre-test score 22 18 20 20 25 Post-test score 35 18 18 41 35 Test at a 5% level of significance whether the PowerPoint presentation makes a difference in the average understanding of the statistical concept. Assume that samples are drawn from a normal population.

Glencoe Algebra 1, Student Edition, 9780079039897, 0079039898, 2018
18th Edition
ISBN:9780079039897
Author:Carter
Publisher:Carter
Chapter10: Statistics
Section10.4: Distributions Of Data
Problem 19PFA

Related questions
Question
Q1
Transcribed Image Text:A lecturer wants to see if a PowerPoint presentation will change students' understanding of a certain
concept in Statistics. Five students were randomly selected for the study and were given a pre-test
on their understanding of the statistical concept. Then, the students viewed the PowerPoint
presentation and afterwards were given a post-test on their understanding of the statistical concept.
The data are shown in the table below:
1.
Student
1
2
3
4.
Pre-test score
22
18
20
20
25
Post-test score
35
18
18
41
35
Test at a 5% level of significance whether the PowerPoint presentation makes a difference in the
average understanding of the statistical concept. Assume that samples are drawn from a normal
population.
Expert Solution
This question has been solved!
Explore an expertly crafted, step-by-step solution for a thorough understanding of key concepts.

Step by step
Solved in 3 steps

Recommended textbooks for you
Glencoe Algebra 1, Student Edition, 9780079039897…
Algebra
ISBN:
9780079039897
Author:
Carter
Publisher:
McGraw Hill

Holt Mcdougal Larson Pre-algebra: Student Edition…
Algebra
ISBN:
9780547587776
Author:
HOLT MCDOUGAL
Publisher:
HOLT MCDOUGAL
Glencoe Algebra 1, Student Edition, 9780079039897…
Algebra
ISBN:
9780079039897
Author:
Carter
Publisher:
McGraw Hill
Holt Mcdougal Larson Pre-algebra: Student Edition…
Algebra
ISBN:
9780547587776
Author:
HOLT MCDOUGAL
Publisher:
HOLT MCDOUGAL