1. A manufacturing company is interested in predicting the number of defects that will be produced each hour on the assembly line. The managers believe that there is a relationship between the defect rate and the production rate per hour. The managers believe that they can use production rate to predict the number of defects. The following data were collected for 8 randomly selected hours. Defects Production rate/h 40 45 20 35 40 50 30 50 Set up a scatter diagram, and discuss what if any relationship appears to be present between two variables. а. | b. Use the least-squares method to predict the number of defects when production rate is 55. c. Interpret the meaning of the regression coefficients in this problem. d. Compute the standard error of the estimate. e. At a significance level of .01 can you conclude that production rate is a good predictor of the number defects? f. Find a 98% confidence interval estimate number of defects when production rate is 55. 231N354 6
1. A manufacturing company is interested in predicting the number of defects that will be produced each hour on the assembly line. The managers believe that there is a relationship between the defect rate and the production rate per hour. The managers believe that they can use production rate to predict the number of defects. The following data were collected for 8 randomly selected hours. Defects Production rate/h 40 45 20 35 40 50 30 50 Set up a scatter diagram, and discuss what if any relationship appears to be present between two variables. а. | b. Use the least-squares method to predict the number of defects when production rate is 55. c. Interpret the meaning of the regression coefficients in this problem. d. Compute the standard error of the estimate. e. At a significance level of .01 can you conclude that production rate is a good predictor of the number defects? f. Find a 98% confidence interval estimate number of defects when production rate is 55. 231N354 6

Holt Mcdougal Larson Pre-algebra: Student Edition 2012
1st Edition
ISBN:9780547587776
Author:HOLT MCDOUGAL
Publisher:HOLT MCDOUGAL
Chapter11: Data Analysis And Probability
Section: Chapter Questions
Problem 8CR

Related questions
Question
100%
I'm a bit confused on how to "discuss the relationship" for part a and "
Interpret" for part c.
I also want to know how to start part E; which test (if any) for I need to use?
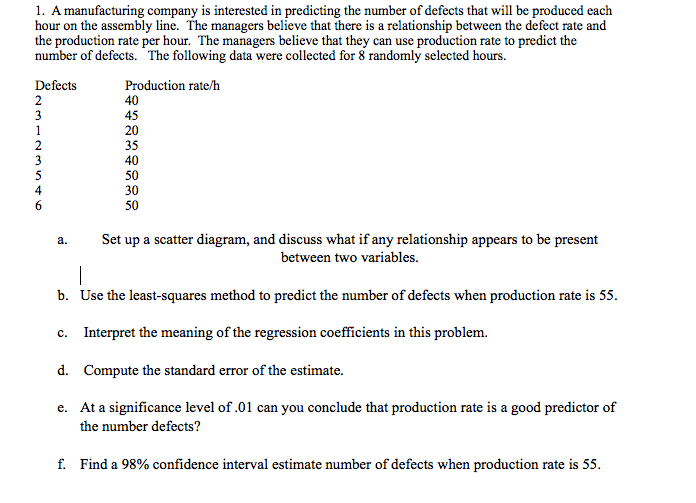
Transcribed Image Text:1. A manufacturing company is interested in predicting the number of defects that will be produced each
hour on the assembly line. The managers believe that there is a relationship between the defect rate and
the production rate per hour. The managers believe that they can use production rate to predict the
number of defects. The following data were collected for 8 randomly selected hours.
Production rate/h
40
45
20
35
40
50
30
50
Defects
2
3
1
3
4
6.
а.
Set up a scatter diagram, and discuss what if any relationship appears to be present
between two variables.
|
b. Use the least-squares method to predict the number of defects when production rate is 55.
c. Interpret the meaning of the regression coefficients in this problem.
d. Compute the standard error of the estimate.
e. At a significance level of .01 can you conclude that production rate is a good predictor of
the number defects?
f. Find a 98% confidence interval estimate number of defects when production rate is 55.
Expert Solution
This question has been solved!
Explore an expertly crafted, step-by-step solution for a thorough understanding of key concepts.

This is a popular solution!

Trending now
This is a popular solution!

Step by step
Solved in 4 steps with 3 images

Recommended textbooks for you
Holt Mcdougal Larson Pre-algebra: Student Edition…
Algebra
ISBN:
9780547587776
Author:
HOLT MCDOUGAL
Publisher:
HOLT MCDOUGAL
Holt Mcdougal Larson Pre-algebra: Student Edition…
Algebra
ISBN:
9780547587776
Author:
HOLT MCDOUGAL
Publisher:
HOLT MCDOUGAL