1. According to an article in Newsweek, the natural ratio of girls to boys is 100:105. In China, the birth ratio is 100:114 (46.7% girls). Suppose you don't believe the reported figures of the percent of girls born in China. You conduct a study. In this study, you count the number of girls and boys born in 150 randomly chosen recent births. There are 64 girls and 86 boys born of the 150. Based on your study, do you believe that the percent of girls born in China is 46.7? Conduct a hypothesis test at the 5% level. a. State the distribution to use for the test. (Round your answers to four decimal places.) b. What is the test statistic? (If using the - distribution round your answers to two decimal places, and if using the t distribution round your answers to three decimal places.) c. What is the p-value? (Round your answer to four decimal places.) d. Construct a 95% confidence interval for the true proportion. Sketch the graph of the situation. Label the point estimate and the lower and upper bounds of the confidence interval. (Round your answers to four decimal places.)
1. According to an article in Newsweek, the natural ratio of girls to boys is 100:105. In China, the birth ratio is 100:114 (46.7% girls). Suppose you don't believe the reported figures of the percent of girls born in China. You conduct a study. In this study, you count the number of girls and boys born in 150 randomly chosen recent births. There are 64 girls and 86 boys born of the 150. Based on your study, do you believe that the percent of girls born in China is 46.7? Conduct a hypothesis test at the 5% level. a. State the distribution to use for the test. (Round your answers to four decimal places.) b. What is the test statistic? (If using the - distribution round your answers to two decimal places, and if using the t distribution round your answers to three decimal places.) c. What is the p-value? (Round your answer to four decimal places.) d. Construct a 95% confidence interval for the true proportion. Sketch the graph of the situation. Label the point estimate and the lower and upper bounds of the confidence interval. (Round your answers to four decimal places.)

Holt Mcdougal Larson Pre-algebra: Student Edition 2012
1st Edition
ISBN:9780547587776
Author:HOLT MCDOUGAL
Publisher:HOLT MCDOUGAL
Chapter11: Data Analysis And Probability
Section11.4: Collecting Data
Problem 3E

Related questions

Topic Video
Question
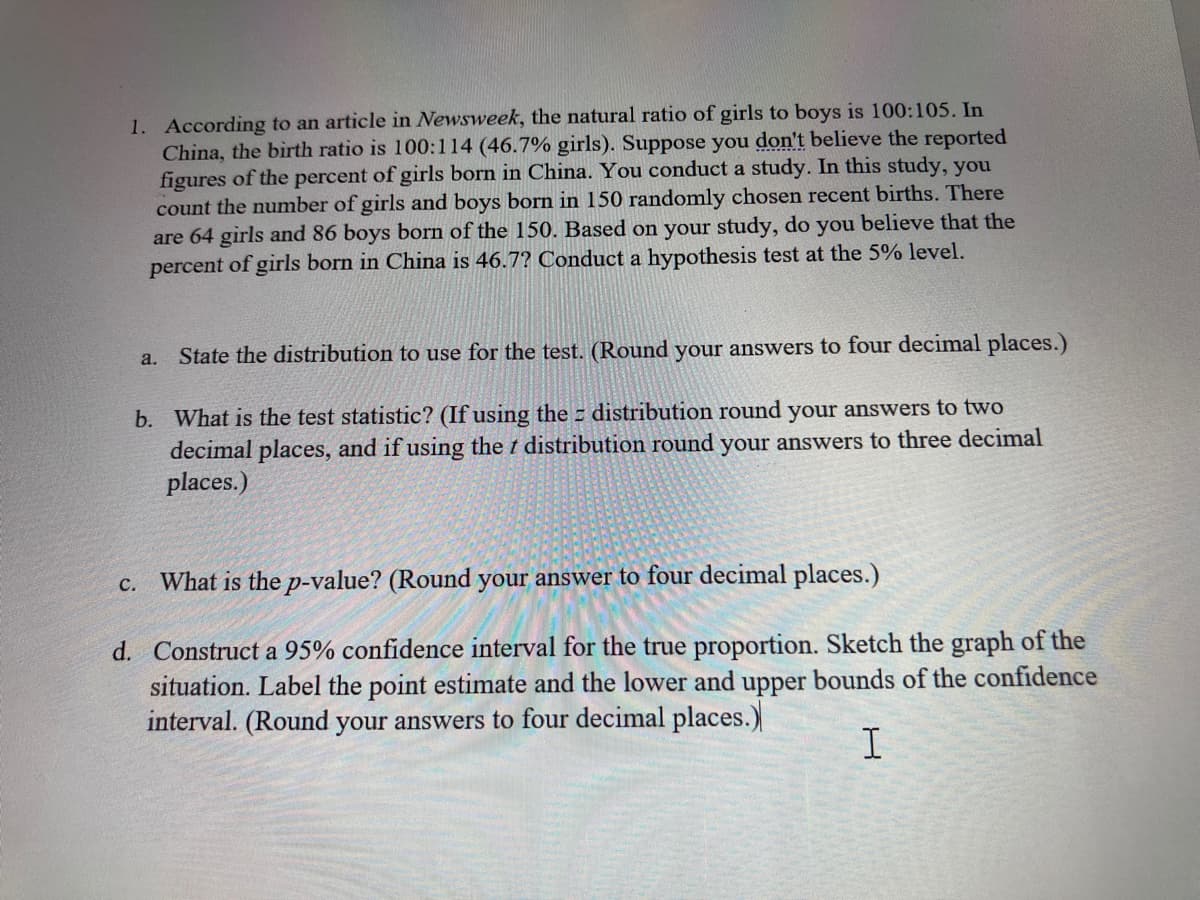
Transcribed Image Text:1. According to an article in Newsweek, the natural ratio of girls to boys is 100:105. In
China, the birth ratio is 100:l14 (46.7% girls). Suppose you don't believe the reported
figures of the percent of girls born in China. You conduct a study. In this study, you
count the number of girls and boys born in 150 randomly chosen recent births. There
are 64 girls and 86 boys born of the 150. Based on your study, do you believe that the
percent of girls born in China is 46.7? Conduct a hypothesis test at the 5% level.
State the distribution to use for the test. (Round your answers to four decimal places.)
a.
b. What is the test statistic? (If using the z distribution round your answers to two
decimal places, and if using the t distribution round your answers to three decimal
places.)
c. What is the p-value? (Round your answer to four decimal places.)
d. Construct a 95% confidence interval for the true proportion. Sketch the graph of the
situation. Label the point estimate and the lower and upper bounds of the confidence
interval. (Round your answers to four decimal places.)
Expert Solution
Step 1
Note: Since you have posted a question with multiple subparts, we will solve the first three subparts for you. To get the remaining subparts solved, please repost the complete question and mention the subparts to be solved.
The test statistic for proportion,

Trending now
This is a popular solution!

Step by step
Solved in 4 steps

Knowledge Booster


Learn more about
Need a deep-dive on the concept behind this application? Look no further. Learn more about this topic, statistics and related others by exploring similar questions and additional content below.Recommended textbooks for you
Holt Mcdougal Larson Pre-algebra: Student Edition…
Algebra
ISBN:
9780547587776
Author:
HOLT MCDOUGAL
Publisher:
HOLT MCDOUGAL
Holt Mcdougal Larson Pre-algebra: Student Edition…
Algebra
ISBN:
9780547587776
Author:
HOLT MCDOUGAL
Publisher:
HOLT MCDOUGAL