1. Classify each of the following variables as quantitative or qualitative and state their measurement scale. (a) Age (in years) (b) Age in categories (0-20, 21-35, 36-45, 45-60, 60-85, 85+) (d) Toxicity (mild, moderate, life-threatening, dead) (e) Blood pressure (f) Time of flight of a missile
1. Classify each of the following variables as quantitative or qualitative and state their measurement scale. (a) Age (in years) (b) Age in categories (0-20, 21-35, 36-45, 45-60, 60-85, 85+) (d) Toxicity (mild, moderate, life-threatening, dead) (e) Blood pressure (f) Time of flight of a missile

Glencoe Algebra 1, Student Edition, 9780079039897, 0079039898, 2018
18th Edition
ISBN:9780079039897
Author:Carter
Publisher:Carter
Chapter10: Statistics
Section10.1: Measures Of Center
Problem 9PPS

Related questions
Question
Transcribed Image Text:12:31 AM AME •
4_57830...4250162
8
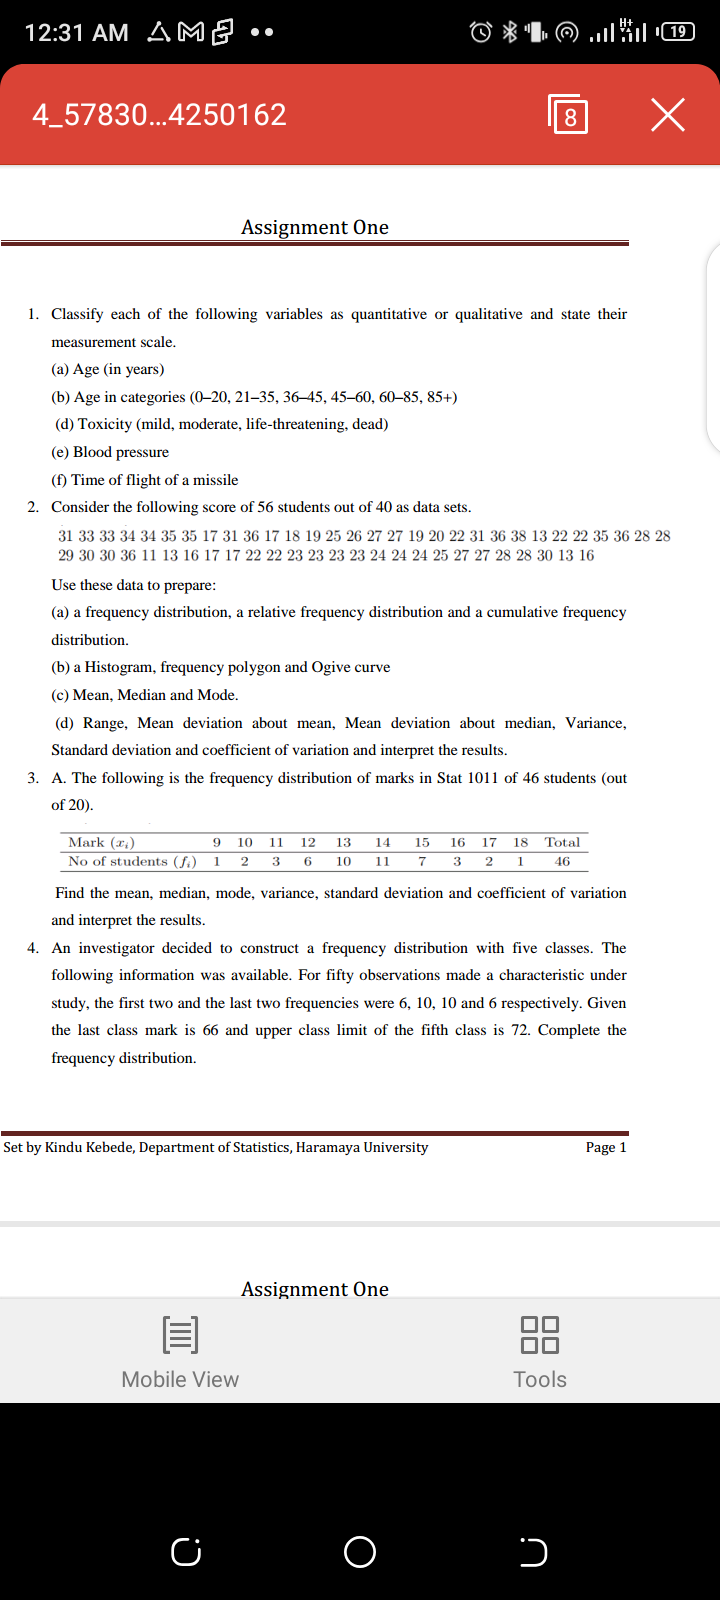
Assignment One
1. Classify each of the following variables as quantitative or qualitative and state their
measurement scale.
(a) Age (in years)
(b) Age in categories (0–20, 21–35, 36–45, 45–60, 60–85, 85+)
(d) Toxicity (mild, moderate, life-threatening, dead)
(e) Blood pressure
(f) Time of flight of a missile
2. Consider the following score of 56 students out of 40 as data sets.
31 33 33 34 34 35 35 17 31 36 17 18 19 25 26 27 27 19 20 22 31 36 38 13 22 22 35 36 28 28
29 30 30 36 11 13 16 17 17 22 22 23 23 23 23 24 24 24 25 27 27 28 28 30 13 16
Use these data to prepare:
(a) a frequency distribution, a relative frequency distribution and a cumulative frequency
distribution.
(b) a Histogram, frequency polygon and Ogive curve
(c) Mean, Median and Mode.
(d) Range, Mean deviation about mean, Mean deviation about median, Variance,
Standard deviation and coefficient of variation and interpret the results.
3. A. The following is the frequency distribution of marks in Stat 1011 of 46 students (out
of 20).
Mark (x:)
10
11
12
13
14
15
16
17
18
Total
No of students (f.) 1
2
6
10
11
3
46
Find the mean, median, mode, variance, standard deviation and coefficient of variation
and interpret the results.
4. An investigator decided to construct a frequency distribution with five classes. The
following information was available. For fifty observations made a characteristic under
study, the first two and the last two frequencies were 6, 10, 10 and 6 respectively. Given
the last class mark is 66 and upper class limit of the fifth class is 72. Complete the
frequency distribution.
Set by Kindu Kebede, Department of Statistics, Haramaya University
Page 1
Assignment One
88
Mobile View
Tools
Expert Solution
This question has been solved!
Explore an expertly crafted, step-by-step solution for a thorough understanding of key concepts.

Step by step
Solved in 2 steps

Recommended textbooks for you
Glencoe Algebra 1, Student Edition, 9780079039897…
Algebra
ISBN:
9780079039897
Author:
Carter
Publisher:
McGraw Hill
Glencoe Algebra 1, Student Edition, 9780079039897…
Algebra
ISBN:
9780079039897
Author:
Carter
Publisher:
McGraw Hill