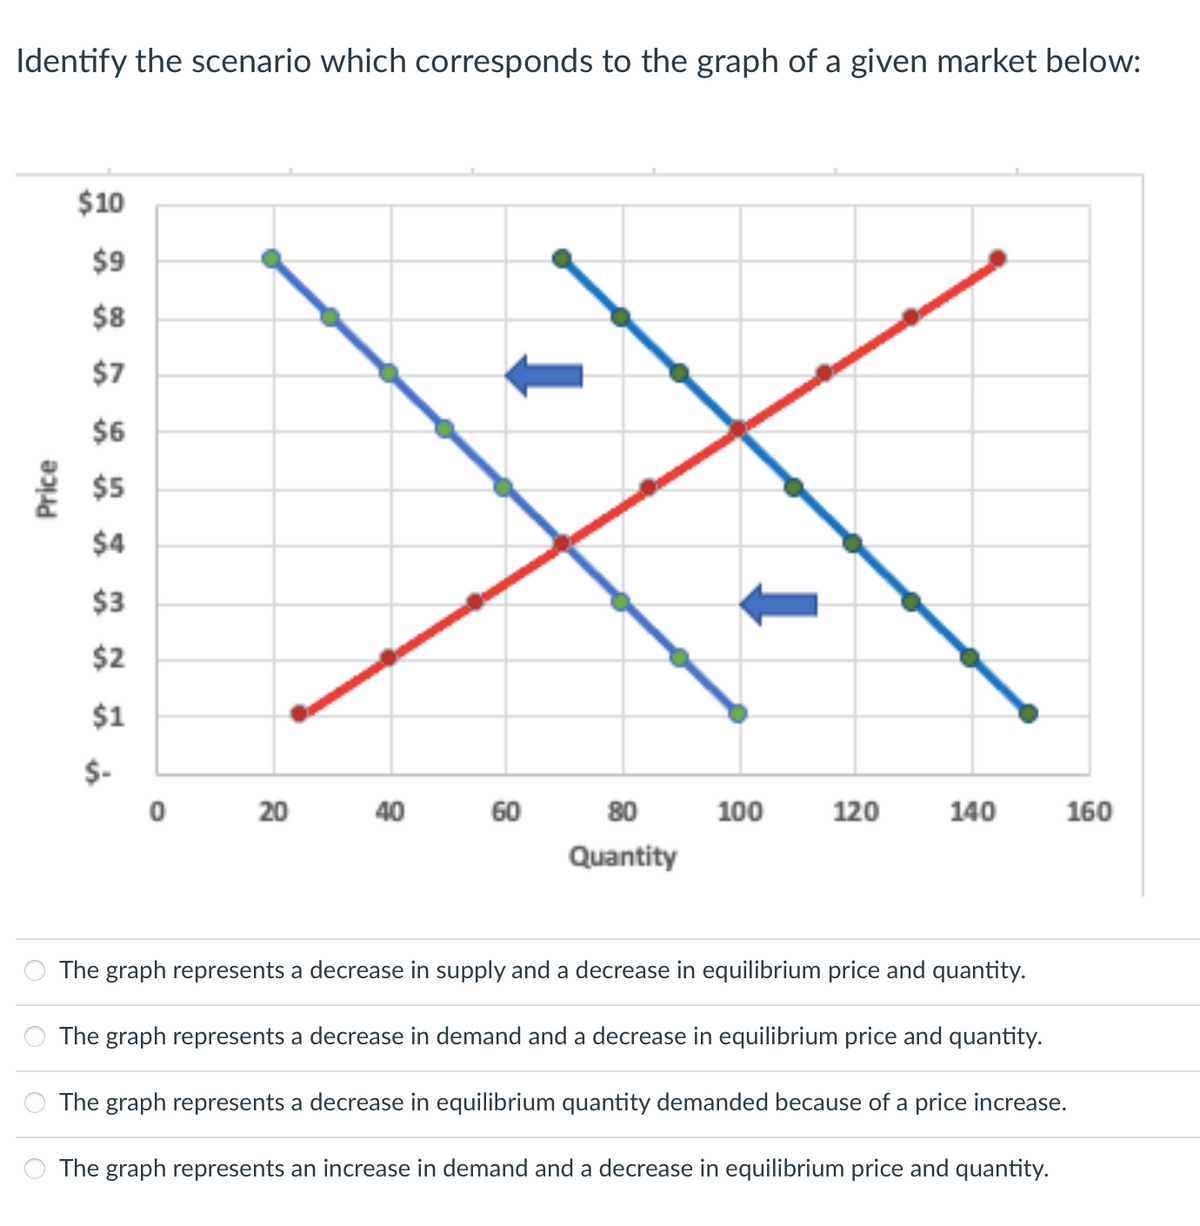
Identify the scenario which corresponds to the graph of a given market below: $10 $9 $8 $7 $6 $5 $4 $3 $2 $1 $- 20 40 60 80 100 120 140 160 Quantity The graph represents a decrease in supply and a decrease in equilibrium price and quantity. The graph represents a decrease in demand and a decrease in equilibrium price and quantity. The graph represents a decrease in equilibrium quantity demanded because of a price increase. The graph represents an increase in demand and a decrease in equilibrium price and quantity.
Identify the scenario which corresponds to the graph of a given market below: $10 $9 $8 $7 $6 $5 $4 $3 $2 $1 $- 20 40 60 80 100 120 140 160 Quantity The graph represents a decrease in supply and a decrease in equilibrium price and quantity. The graph represents a decrease in demand and a decrease in equilibrium price and quantity. The graph represents a decrease in equilibrium quantity demanded because of a price increase. The graph represents an increase in demand and a decrease in equilibrium price and quantity.

Micro Economics For Today
10th Edition
ISBN:9781337613064
Author:Tucker, Irvin B.
Publisher:Tucker, Irvin B.
Chapter4: Markets In Action
Section: Chapter Questions
Problem 1SQ

Related questions
Question
Transcribed Image Text:Identify the scenario which corresponds to the graph of a given market below:
$10
$9
$8
$7
$6
$5
$4
$3
$2
$1
$-
20
40
60
80
100
120
140
160
Quantity
The graph represents a decrease in supply and a decrease in equilibrium price and quantity.
The graph represents a decrease in demand and a decrease in equilibrium price and quantity.
The graph represents a decrease in equilibrium quantity demanded because of a price increase.
The graph represents an increase in demand and a decrease in equilibrium price and quantity.
Price
Expert Solution
This question has been solved!
Explore an expertly crafted, step-by-step solution for a thorough understanding of key concepts.

This is a popular solution!

Trending now
This is a popular solution!

Step by step
Solved in 2 steps

Recommended textbooks for you


Exploring Economics
Economics
ISBN:
9781544336329
Author:
Robert L. Sexton
Publisher:
SAGE Publications, Inc
Exploring Economics
Economics
ISBN:
9781544336329
Author:
Robert L. Sexton
Publisher:
SAGE Publications, Inc

Survey of Economics (MindTap Course List)
Economics
ISBN:
9781305260948
Author:
Irvin B. Tucker
Publisher:
Cengage Learning

Microeconomics: Principles & Policy
Economics
ISBN:
9781337794992
Author:
William J. Baumol, Alan S. Blinder, John L. Solow
Publisher:
Cengage Learning
