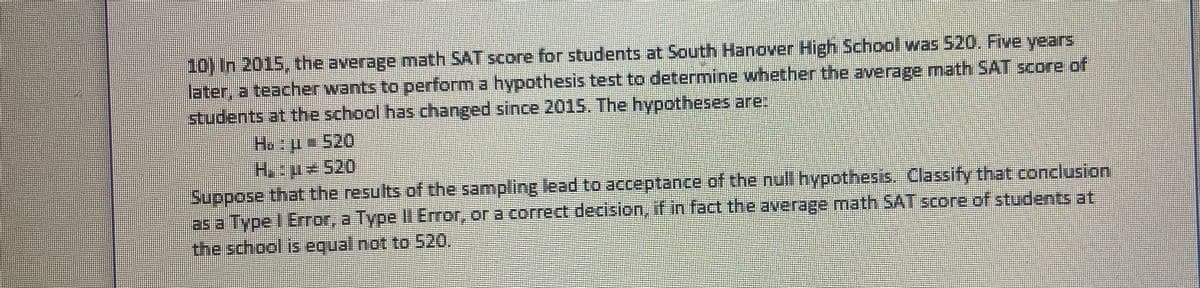
10) In 2015, the average math SAT score for students at South Hanover High School was 520. Five years later, a teacher wants to perform a hypothesis test to determine whether the average math SAT score of students at the school has changed since 2015. The hypotheses are: Ha : u- 520 H:u= 520 Suppose that the results of the sampling lead to acceptance of the null hypothesis. Classify that conclusion as a Type I Error, a Type II Error, or a correct decision, if in fact the average math SAT score of students at the school is equal not to 520.
10) In 2015, the average math SAT score for students at South Hanover High School was 520. Five years later, a teacher wants to perform a hypothesis test to determine whether the average math SAT score of students at the school has changed since 2015. The hypotheses are: Ha : u- 520 H:u= 520 Suppose that the results of the sampling lead to acceptance of the null hypothesis. Classify that conclusion as a Type I Error, a Type II Error, or a correct decision, if in fact the average math SAT score of students at the school is equal not to 520.

MATLAB: An Introduction with Applications
6th Edition
ISBN:9781119256830
Author:Amos Gilat
Publisher:Amos Gilat
Chapter1: Starting With Matlab
Section: Chapter Questions
Problem 1P

Related questions
Topic Video
Question
n 2015, the average math SAT score for students at South Hanover High School was 520. Five years later, a teacher wants to perform a hypothesis test to determine whether the average math SAT score of students at the school has changed since 2015. The hypotheses are:
Ho: = 520
Ha: 520
Suppose that the results of the sampling lead to acceptance of the null hypothesis. Classify that conclusion as a Type I Error, a Type II Error, or a correct decision, if in fact the average math SAT score of students at the school is equalnotto 520.
Transcribed Image Text:10) In 2015, the average math SAT score for students at South Hanover High School was 520. Five years
later, a teacher wants to perform a hypothesis test to determine whether the average math SAT score of
students at the school has changed since 2015. The hypotheses are:
H, +520
Suppose that the results of the sampling lead to acceptance of the null hypothesis. Classify that conclusion
as a Type I Error, a Type I Error, or a correct decision, if in fact the average math SAT score of students at
the school is equal not to 520
Expert Solution
This question has been solved!
Explore an expertly crafted, step-by-step solution for a thorough understanding of key concepts.

This is a popular solution!

Trending now
This is a popular solution!

Step by step
Solved in 2 steps

Knowledge Booster


Learn more about
Need a deep-dive on the concept behind this application? Look no further. Learn more about this topic, statistics and related others by exploring similar questions and additional content below.Recommended textbooks for you
MATLAB: An Introduction with Applications
Statistics
ISBN:
9781119256830
Author:
Amos Gilat
Publisher:
John Wiley & Sons Inc

Probability and Statistics for Engineering and th…
Statistics
ISBN:
9781305251809
Author:
Jay L. Devore
Publisher:
Cengage Learning

Statistics for The Behavioral Sciences (MindTap C…
Statistics
ISBN:
9781305504912
Author:
Frederick J Gravetter, Larry B. Wallnau
Publisher:
Cengage Learning
MATLAB: An Introduction with Applications
Statistics
ISBN:
9781119256830
Author:
Amos Gilat
Publisher:
John Wiley & Sons Inc
Probability and Statistics for Engineering and th…
Statistics
ISBN:
9781305251809
Author:
Jay L. Devore
Publisher:
Cengage Learning
Statistics for The Behavioral Sciences (MindTap C…
Statistics
ISBN:
9781305504912
Author:
Frederick J Gravetter, Larry B. Wallnau
Publisher:
Cengage Learning

Elementary Statistics: Picturing the World (7th E…
Statistics
ISBN:
9780134683416
Author:
Ron Larson, Betsy Farber
Publisher:
PEARSON

The Basic Practice of Statistics
Statistics
ISBN:
9781319042578
Author:
David S. Moore, William I. Notz, Michael A. Fligner
Publisher:
W. H. Freeman

Introduction to the Practice of Statistics
Statistics
ISBN:
9781319013387
Author:
David S. Moore, George P. McCabe, Bruce A. Craig
Publisher:
W. H. Freeman