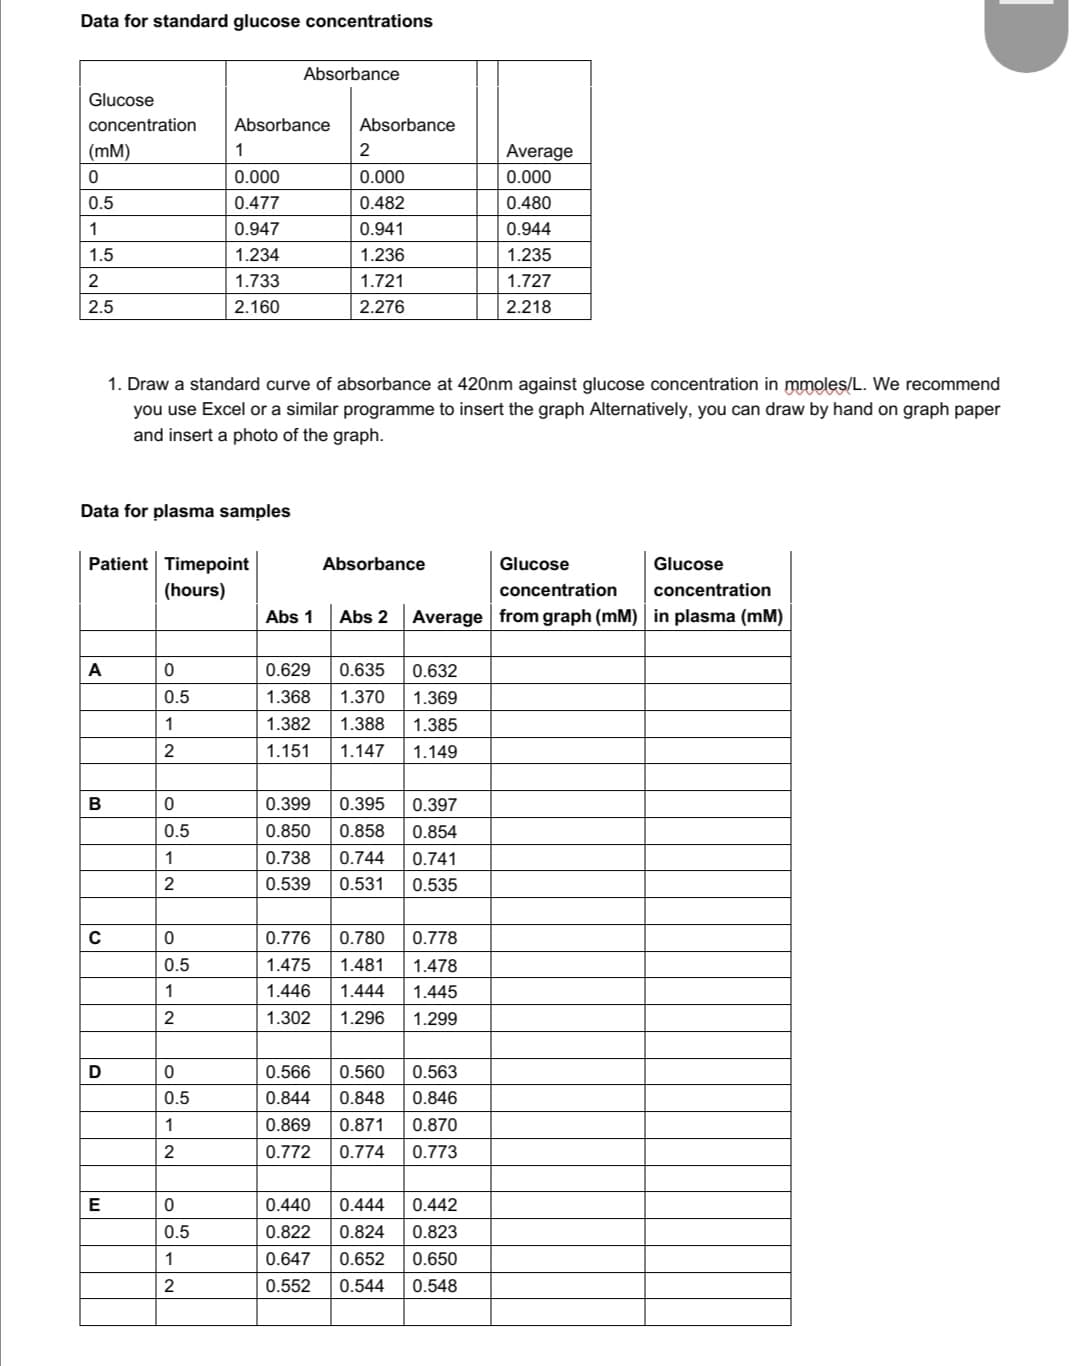
1. Draw a standard curve of absorbance at 420nm against glucose concentration in mmoles/L. We recommend you use Excel or a similar programme to insert the graph Alternatively, you can draw by hand on graph paper and insert a photo of the graph.
1. Draw a standard curve of absorbance at 420nm against glucose concentration in mmoles/L. We recommend you use Excel or a similar programme to insert the graph Alternatively, you can draw by hand on graph paper and insert a photo of the graph.
Chapter21: Heparin Infusion Calculations
Section: Chapter Questions
Problem 2.1P
Related questions
Question

Transcribed Image Text:Data for standard glucose concentrations
Glucose
concentration
(mm)
0
0.5
1
1.5
-~~
2
2.5
A
Data for plasma samples
B
Patient Timepoint
(hours)
C
D
E
0
0.5
1
2
0
0.5
1
2
0
0.5
1
2
1. Draw a standard curve of absorbance at 420nm against glucose concentration in mmoles/L. We recommend
you use Excel or a similar programme to insert the graph Alternatively, you can draw by hand on graph paper
and insert a photo of the graph.
OON
0
0.5
1
Absorbance
1
0.000
0.477
0.947
1.234
1.733
2.160
2
0
0.5
1
Absorbance
Absorbance
2
0.000
0.482
0.941
1.236
1.721
2.276
Absorbance
Glucose
concentration
Glucose
concentration
Abs 1 Abs 2 Average from graph (mM) in plasma (mm)
0.635 0.632
0.629
1.368 1.370 1.369
1.382 1.388 1.385
1.151 1.147 1.149
0.566
0.844
0.869
0.772
0.395 0.397
0.399
0.850 0.858 0.854
0.738 0.744 0.741
0.539 0.531 0.535
0.776 0.780 0.778
1.475 1.481 1.478
1.446 1.444 1.445
1.302 1.296 1.299
0.560 0.563
0.848 0.846
0.871
0.870
0.774 0.773
Average
0.000
0.480
0.944
1.235
1.727
2.218
0.440 0.444 0.442
0.822 0.824 0.823
0.647 0.652 0.650
0.552 0.544
0.548
F
Expert Solution
This question has been solved!
Explore an expertly crafted, step-by-step solution for a thorough understanding of key concepts.
This is a popular solution!
Trending now
This is a popular solution!
Step by step
Solved in 2 steps with 1 images

Recommended textbooks for you


