1. Express the mathematical function for the straight line with the correct number of significant figures in the slope and y-intercept. y=- 2. What was the rate of heating for this sample of water (°C/sec)? Rate of Heating 3. Show a calculation or explain how to determine the initial temperature of the water (at the beginning of the experiment, before any data was collected) using the linear regression analysis. Include a correct unit label.
1. Express the mathematical function for the straight line with the correct number of significant figures in the slope and y-intercept. y=- 2. What was the rate of heating for this sample of water (°C/sec)? Rate of Heating 3. Show a calculation or explain how to determine the initial temperature of the water (at the beginning of the experiment, before any data was collected) using the linear regression analysis. Include a correct unit label.

Chapter4: Least-squares And Calibration Methods
Section: Chapter Questions
Problem 12P

Related questions
Question
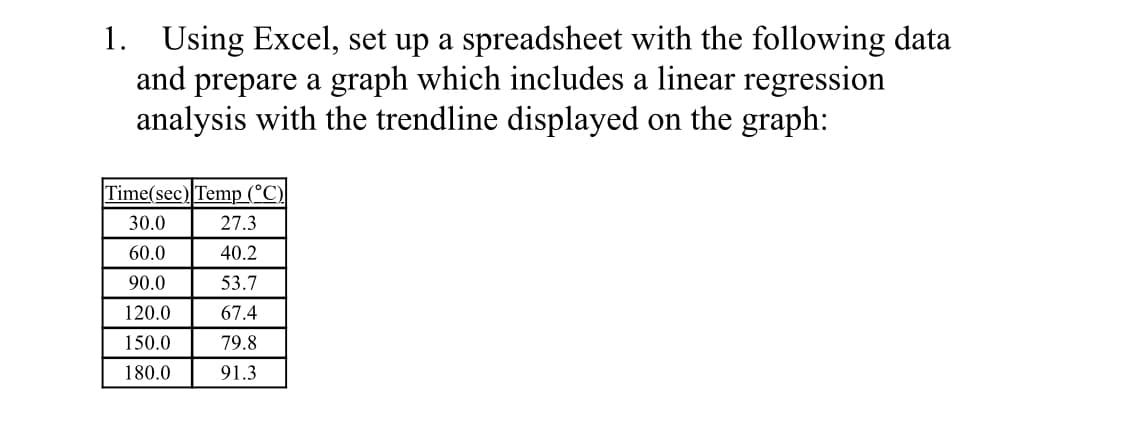
Transcribed Image Text:1. Using Excel, set up a spreadsheet with the following data
and prepare a graph which includes a linear regression
analysis with the trendline displayed on the graph:
Time(sec) Temp (°C)
30.0
27.3
60.0
40.2
90.0
53.7
120.0
67.4
150.0
79.8
180.0
91.3
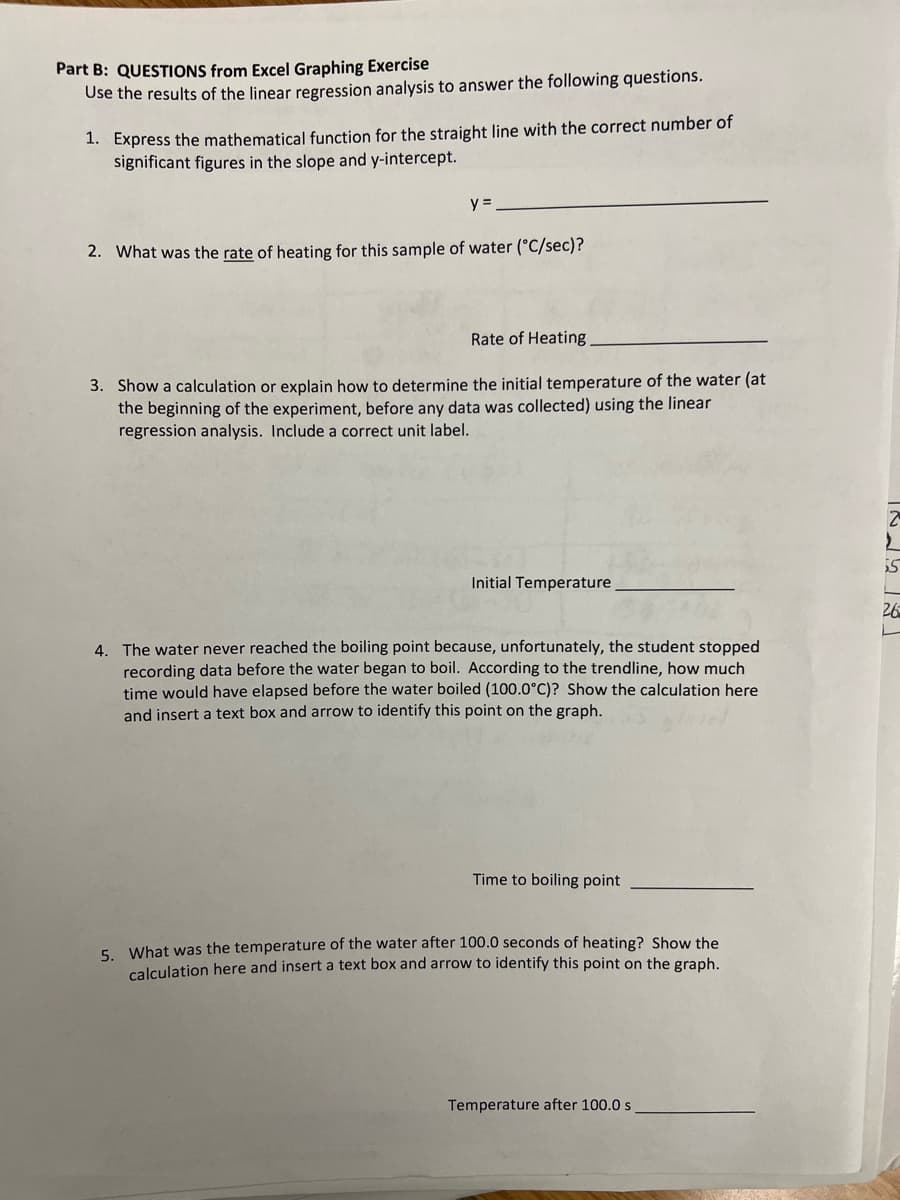
Transcribed Image Text:Part B: QUESTIONS from Excel Graphing Exercise
Use the results of the linear regression analysis to answer the following questions.
1. Express the mathematical function for the straight line with the correct number of
significant figures in the slope and y-intercept.
y =
2. What was the rate of heating for this sample of water (°C/sec)?
Rate of Heating
3. Show a calculation or explain how to determine the initial temperature of the water (at
the beginning of the experiment, before any data was collected) using the linear
regression analysis. Include a correct unit label.
Initial Temperature
4. The water never reached the boiling point because, unfortunately, the student stopped
recording data before the water began to boil. According to the trendline, how much
time would have elapsed before the water boiled (100.0°C)? Show the calculation here
and insert a text box and arrow to identify this point on the graph.
Time to boiling point
5. What was the temperature of the water after 100.0 seconds of heating? Show the
calculation here and insert a text box and arrow to identify this point on the graph.
Temperature after 100.0 s
55
26
Expert Solution
This question has been solved!
Explore an expertly crafted, step-by-step solution for a thorough understanding of key concepts.

Step by step
Solved in 5 steps with 1 images

Knowledge Booster


Learn more about
Need a deep-dive on the concept behind this application? Look no further. Learn more about this topic, chemistry and related others by exploring similar questions and additional content below.Recommended textbooks for you