1. Given lists of different temperatures in Fahrenheit. Give its frequency distribution table with class interval, then draw/give the graph and find the mean, median, and mode. Show your solutions. You can use MS Excel for frequency distribution and graphs. 97.1 97.8 98.0 98.7 99.5 96.3 98.4 98.5 98.0 100.8 98.6 98.2 99.0 99.3 98.8 97.6 97.4 99.0 97.4 96.4 98.0 98.1 97.8 98.5 98.7 98.8 98.2 97.6 98.2 98.8
1. Given lists of different temperatures in Fahrenheit. Give its frequency distribution table with class interval, then draw/give the graph and find the mean, median, and mode. Show your solutions. You can use MS Excel for frequency distribution and graphs. 97.1 97.8 98.0 98.7 99.5 96.3 98.4 98.5 98.0 100.8 98.6 98.2 99.0 99.3 98.8 97.6 97.4 99.0 97.4 96.4 98.0 98.1 97.8 98.5 98.7 98.8 98.2 97.6 98.2 98.8

Glencoe Algebra 1, Student Edition, 9780079039897, 0079039898, 2018
18th Edition
ISBN:9780079039897
Author:Carter
Publisher:Carter
Chapter10: Statistics
Section10.6: Summarizing Categorical Data
Problem 4CGP

Related questions
Question
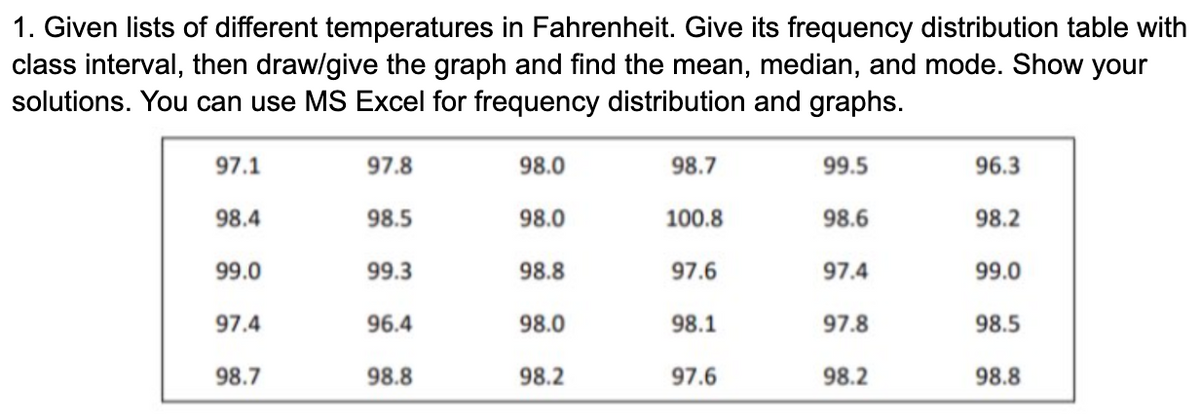
Transcribed Image Text:1. Given lists of different temperatures in Fahrenheit. Give its frequency distribution table with
class interval, then draw/give the graph and find the mean, median, and mode. Show your
solutions. You can use MS Excel for frequency distribution and graphs.
97.1
97.8
98.0
98.7
99.5
96.3
98.4
98.5
98.0
100.8
98.6
98.2
99.0
99.3
98.8
97.6
97.4
99.0
97.4
96.4
98.0
98.1
97.8
98.5
98.7
98.8
98.2
97.6
98.2
98.8
Expert Solution
This question has been solved!
Explore an expertly crafted, step-by-step solution for a thorough understanding of key concepts.

Step by step
Solved in 5 steps with 5 images

Recommended textbooks for you
Glencoe Algebra 1, Student Edition, 9780079039897…
Algebra
ISBN:
9780079039897
Author:
Carter
Publisher:
McGraw Hill
Glencoe Algebra 1, Student Edition, 9780079039897…
Algebra
ISBN:
9780079039897
Author:
Carter
Publisher:
McGraw Hill