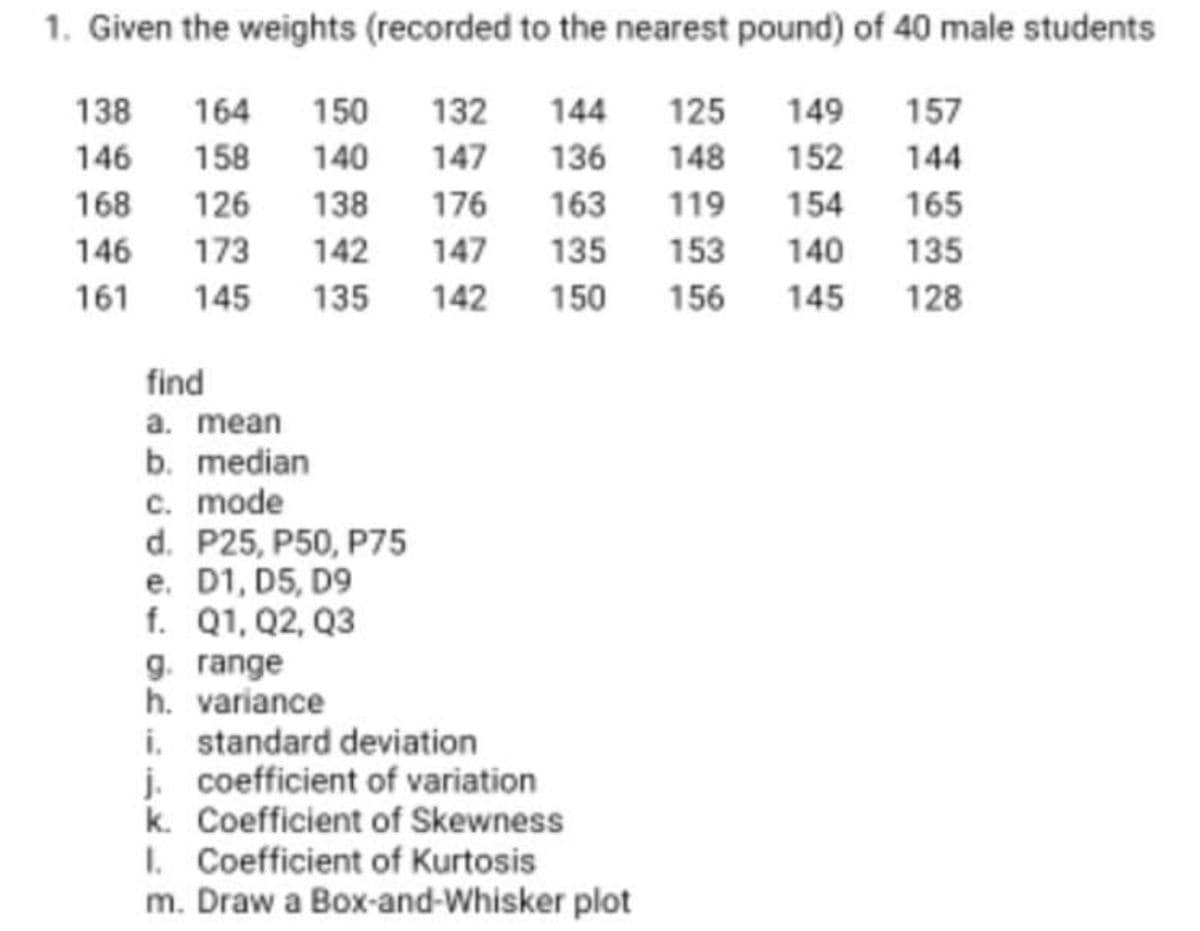
1. Given the weights (recorded to the nearest pound) of 40 male students 138 164 150 132 144 125 149 157 146 158 140 147 136 148 152 144 168 126 138 176 163 119 154 165 146 173 142 147 135 153 140 135 161 145 135 142 150 156 145 128 find a. mean b. median c. mode
1. Given the weights (recorded to the nearest pound) of 40 male students 138 164 150 132 144 125 149 157 146 158 140 147 136 148 152 144 168 126 138 176 163 119 154 165 146 173 142 147 135 153 140 135 161 145 135 142 150 156 145 128 find a. mean b. median c. mode

Glencoe Algebra 1, Student Edition, 9780079039897, 0079039898, 2018
18th Edition
ISBN:9780079039897
Author:Carter
Publisher:Carter
Chapter10: Statistics
Section10.5: Comparing Sets Of Data
Problem 14PPS

Related questions
Question
Transcribed Image Text:1. Given the weights (recorded to the nearest pound) of 40 male students
138
164
150
132
144
125
149
157
146
158
140
147
136
148
152
144
168
126
138
176
163
119
154
165
146
173
142
147
135
153
140
135
161
145
135
142
150
156
145
128
find
a. mean
b. median
c. mode
d. P25, P50, P75
e. D1, D5, D9
f. Q1, Q2, Q3
g. range
h. variance
i. standard deviation
j. coefficient of variation
k. Coefficient of Skewness
I. Coefficient of Kurtosis
m. Draw a Box-and-Whisker plot
Expert Solution
This question has been solved!
Explore an expertly crafted, step-by-step solution for a thorough understanding of key concepts.

Step by step
Solved in 3 steps

Recommended textbooks for you
Glencoe Algebra 1, Student Edition, 9780079039897…
Algebra
ISBN:
9780079039897
Author:
Carter
Publisher:
McGraw Hill
Glencoe Algebra 1, Student Edition, 9780079039897…
Algebra
ISBN:
9780079039897
Author:
Carter
Publisher:
McGraw Hill