1. I made this in Microsoft Word and Google isn't uploading it correctly. Use the table below to cakculate savings and the APC, APS, MPC, and MPS. Net Income Consumption Savings АРС APS MPC MPS $42,000 $50,000 $60,000 $45,000 $70,000 $50,000 $80,000 $60,000 $90,000 $75,000
1. I made this in Microsoft Word and Google isn't uploading it correctly. Use the table below to cakculate savings and the APC, APS, MPC, and MPS. Net Income Consumption Savings АРС APS MPC MPS $42,000 $50,000 $60,000 $45,000 $70,000 $50,000 $80,000 $60,000 $90,000 $75,000

Chapter11: Fiscal Policy
Section: Chapter Questions
Problem 1.6P

Related questions
Question
Please ???
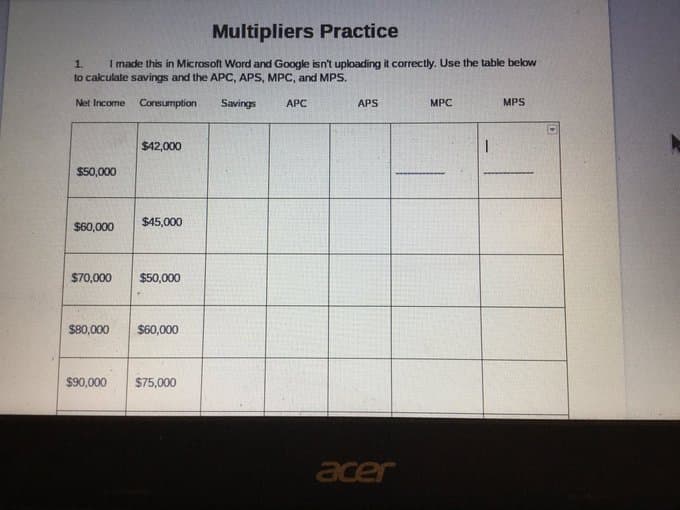
Transcribed Image Text:Multipliers Practice
I made this in Microsoft Word and Google isn't uploading it correctly. Use the table below
1.
to calculate savings and the APC, APS, MPC, and MPS.
Net Income
Consumption
Savings
APC
APS
MPC
MPS
$42,000
$50,000
$45,000
$60,000
$70,000
$50,000
$80,000
$60,000
$90,000
$75,000
acer
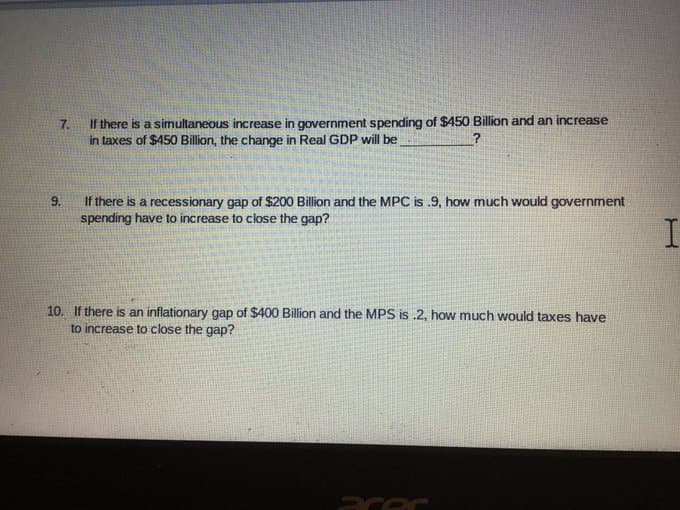
Transcribed Image Text:7.
If there is a simultaneous increase in government spending of $450 Billion and an increase
in taxes of $450 Billion, the change in Real GDP will be
?
If there is a recessionary gap of $200 Billion and the MPC is .9, how much would government
spending have to increase to close the gap?
9.
10. If there is an inflationary gap of $400 Billion and the MPS is .2, how much would taxes have
to increase to close the gap?
Expert Solution
This question has been solved!
Explore an expertly crafted, step-by-step solution for a thorough understanding of key concepts.

Step by step
Solved in 2 steps

Knowledge Booster


Learn more about
Need a deep-dive on the concept behind this application? Look no further. Learn more about this topic, economics and related others by exploring similar questions and additional content below.Recommended textbooks for you