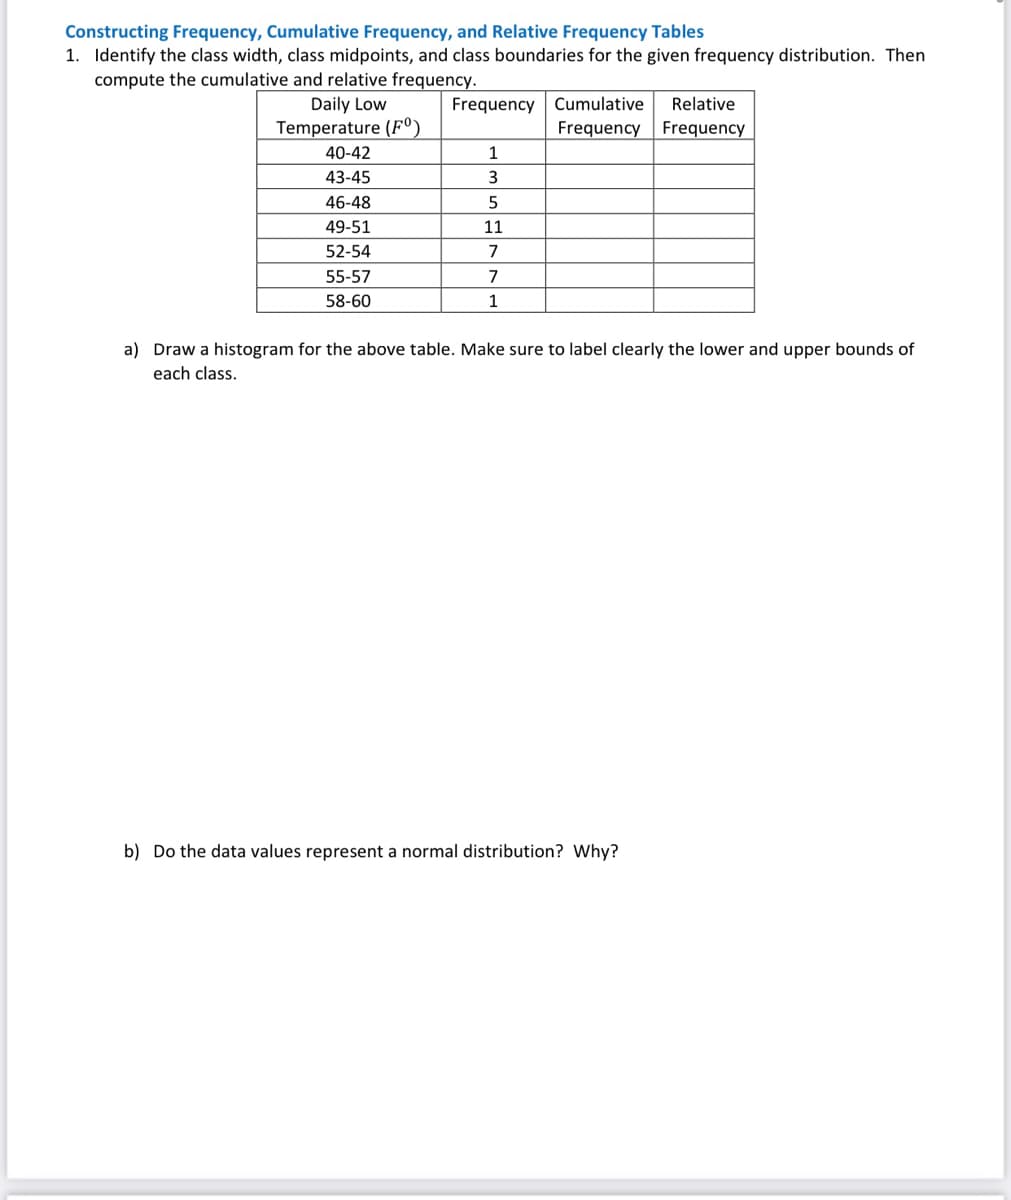
1. Identify the class width, class midpoints, and class boundaries for the given frequency distribution. Then compute the cumulative and relative frequency. Daily Low Frequency Cumulative Relative Temperature (FO) Frequency Frequency 40-42 1 43-45 3 46-48 5 49-51 11 52-54 7 55-57 7 58-60 1 a) Draw a histogram for the above table. Make sure to label clearly the lower and upper bounds of each class.
1. Identify the class width, class midpoints, and class boundaries for the given frequency distribution. Then compute the cumulative and relative frequency. Daily Low Frequency Cumulative Relative Temperature (FO) Frequency Frequency 40-42 1 43-45 3 46-48 5 49-51 11 52-54 7 55-57 7 58-60 1 a) Draw a histogram for the above table. Make sure to label clearly the lower and upper bounds of each class.
Big Ideas Math A Bridge To Success Algebra 1: Student Edition 2015
1st Edition
ISBN:9781680331141
Author:HOUGHTON MIFFLIN HARCOURT
Publisher:HOUGHTON MIFFLIN HARCOURT
Chapter11: Data Analysis And Displays
Section: Chapter Questions
Problem 11CR
Related questions
Topic Video
Question
Hey i need help (1 fill in the box , a-b ))
2 , 3 (a,b,c)

Transcribed Image Text:Constructing Frequency, Cumulative Frequency, and Relative Frequency Tables
1. Identify the class width, class midpoints, and class boundaries for the given frequency distribution. Then
compute the cumulative and relative frequency.
Daily Low
Frequency Cumulative
Relative
Temperature (F°)
Frequency Frequency
40-42
1
43-45
3
46-48
5
49-51
11
52-54
7
55-57
7
58-60
1
a) Draw a histogram for the above table. Make sure to label clearly the lower and upper bounds of
each class.
b) Do the data values represent a normal distribution? Why?

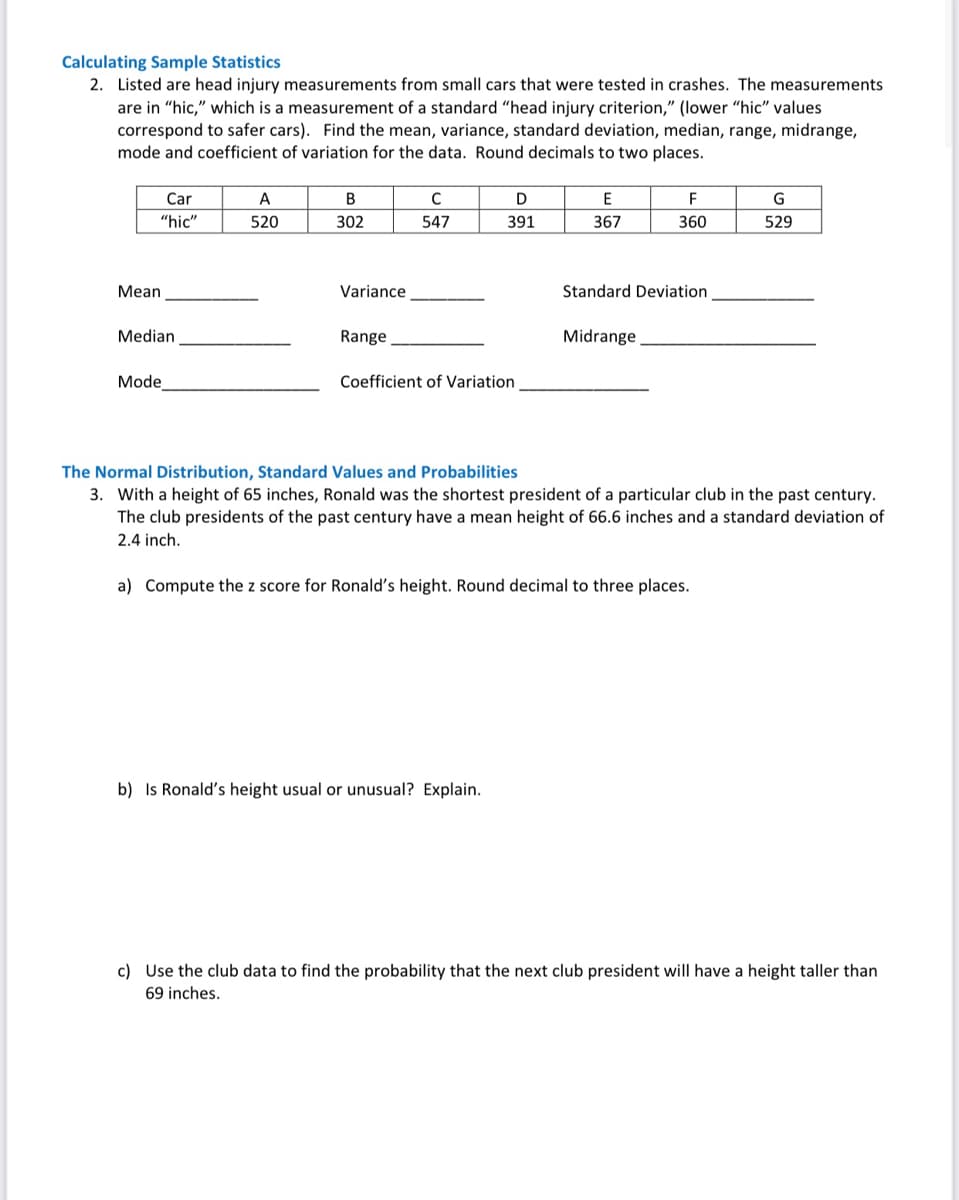
Transcribed Image Text:Calculating Sample Statistics
2. Listed are head injury measurements from small cars that were tested in crashes. The measurements
are in "hic," which is a measurement of a standard "head injury criterion," (lower "hic" values
correspond to safer cars). Find the mean, variance, standard deviation, median, range, midrange,
mode and coefficient of variation for the data. Round decimals to two places.
Car
A
В
C
D
E
F
"hic"
520
302
547
391
367
360
529
Mean
Variance
Standard Deviation
Median
Range
Midrange
Mode
Coefficient of Variation
The Normal Distribution, Standard Values and Probabilities
3. With a height of 65 inches, Ronald was the shortest president of a particular club in the past century.
The club presidents of the past century have a mean height of 66.6 inches and a standard deviation of
2.4 inch.
a) Compute the z score for Ronald's height. Round decimal to three places.
b) Is Ronald's height usual or unusual? Explain.
c) Use the club data to find the probability that the next club president will have a height taller than
69 inches.
Expert Solution
This question has been solved!
Explore an expertly crafted, step-by-step solution for a thorough understanding of key concepts.
This is a popular solution!
Trending now
This is a popular solution!
Step by step
Solved in 4 steps with 1 images

Knowledge Booster
Learn more about
Need a deep-dive on the concept behind this application? Look no further. Learn more about this topic, statistics and related others by exploring similar questions and additional content below.Recommended textbooks for you

Big Ideas Math A Bridge To Success Algebra 1: Stu…
Algebra
ISBN:
9781680331141
Author:
HOUGHTON MIFFLIN HARCOURT
Publisher:
Houghton Mifflin Harcourt

Glencoe Algebra 1, Student Edition, 9780079039897…
Algebra
ISBN:
9780079039897
Author:
Carter
Publisher:
McGraw Hill

Holt Mcdougal Larson Pre-algebra: Student Edition…
Algebra
ISBN:
9780547587776
Author:
HOLT MCDOUGAL
Publisher:
HOLT MCDOUGAL

Big Ideas Math A Bridge To Success Algebra 1: Stu…
Algebra
ISBN:
9781680331141
Author:
HOUGHTON MIFFLIN HARCOURT
Publisher:
Houghton Mifflin Harcourt

Glencoe Algebra 1, Student Edition, 9780079039897…
Algebra
ISBN:
9780079039897
Author:
Carter
Publisher:
McGraw Hill

Holt Mcdougal Larson Pre-algebra: Student Edition…
Algebra
ISBN:
9780547587776
Author:
HOLT MCDOUGAL
Publisher:
HOLT MCDOUGAL