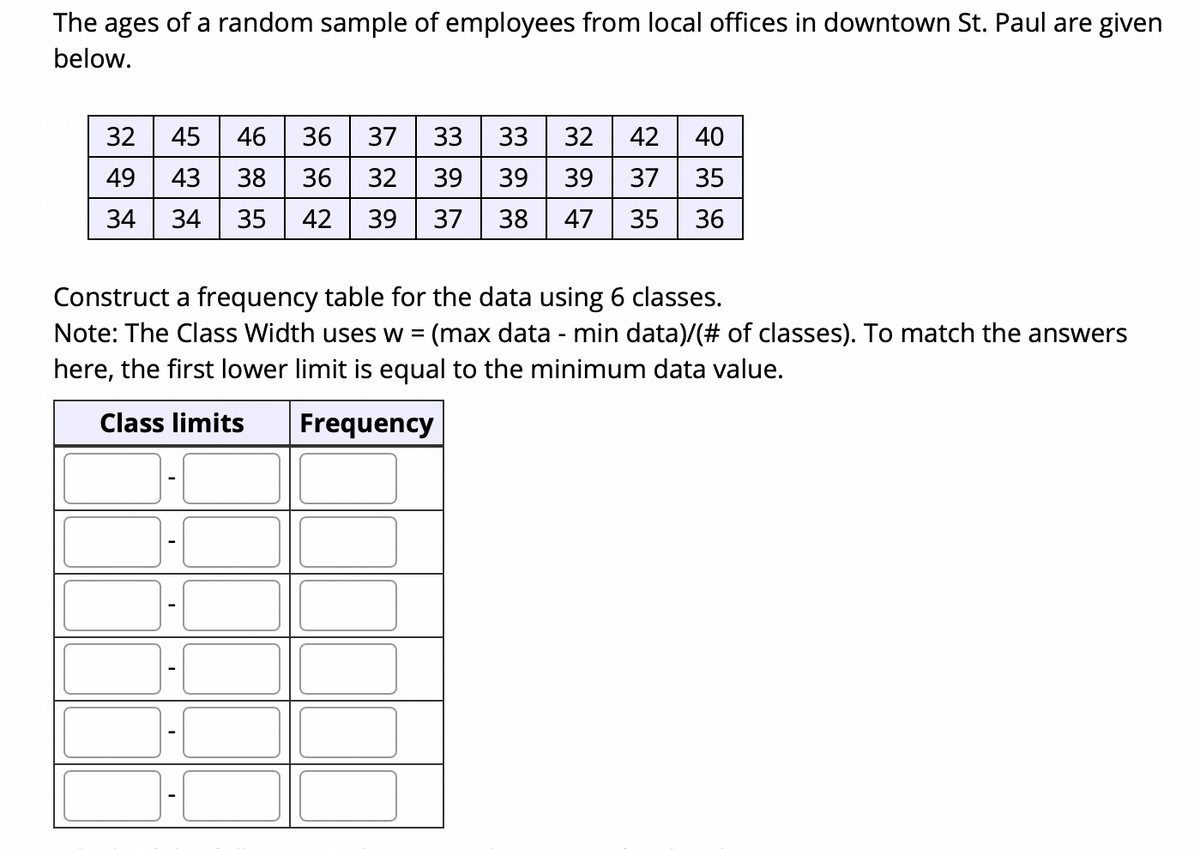
The ages of a random sample of employees from local offices in downtown St. Paul are given below. 32 45 46 36 37 33 33 32 42 40 49 43 38 36 32 39 39 39 37 35 34 34 35 42 39 37 38 47 35 36 Construct a frequency table for the data using 6 classes. Note: The Class Width uses w = (max data - min data)/(# of classes). To match the answers %3D here, the first lower limit is equal to the minimum data value. Class limits Frequency
The ages of a random sample of employees from local offices in downtown St. Paul are given below. 32 45 46 36 37 33 33 32 42 40 49 43 38 36 32 39 39 39 37 35 34 34 35 42 39 37 38 47 35 36 Construct a frequency table for the data using 6 classes. Note: The Class Width uses w = (max data - min data)/(# of classes). To match the answers %3D here, the first lower limit is equal to the minimum data value. Class limits Frequency

Glencoe Algebra 1, Student Edition, 9780079039897, 0079039898, 2018
18th Edition
ISBN:9780079039897
Author:Carter
Publisher:Carter
Chapter10: Statistics
Section10.6: Summarizing Categorical Data
Problem 4BGP

Related questions
Question
help, please. thank you
Transcribed Image Text:The ages of a random sample of employees from local offices in downtown St. Paul are given
below.
42 | 40
37 35
35 36
32
45
46
36
37
33
33
32
49
43
38
36
32
39
39
39
34
34
35
42
39
37
38
47
Construct a frequency table for the data using 6 classes.
Note: The Class Width uses w = (max data - min data)/(# of classes). To match the answers
here, the first lower limit is equal to the minimum data value.
Class limits
Frequency
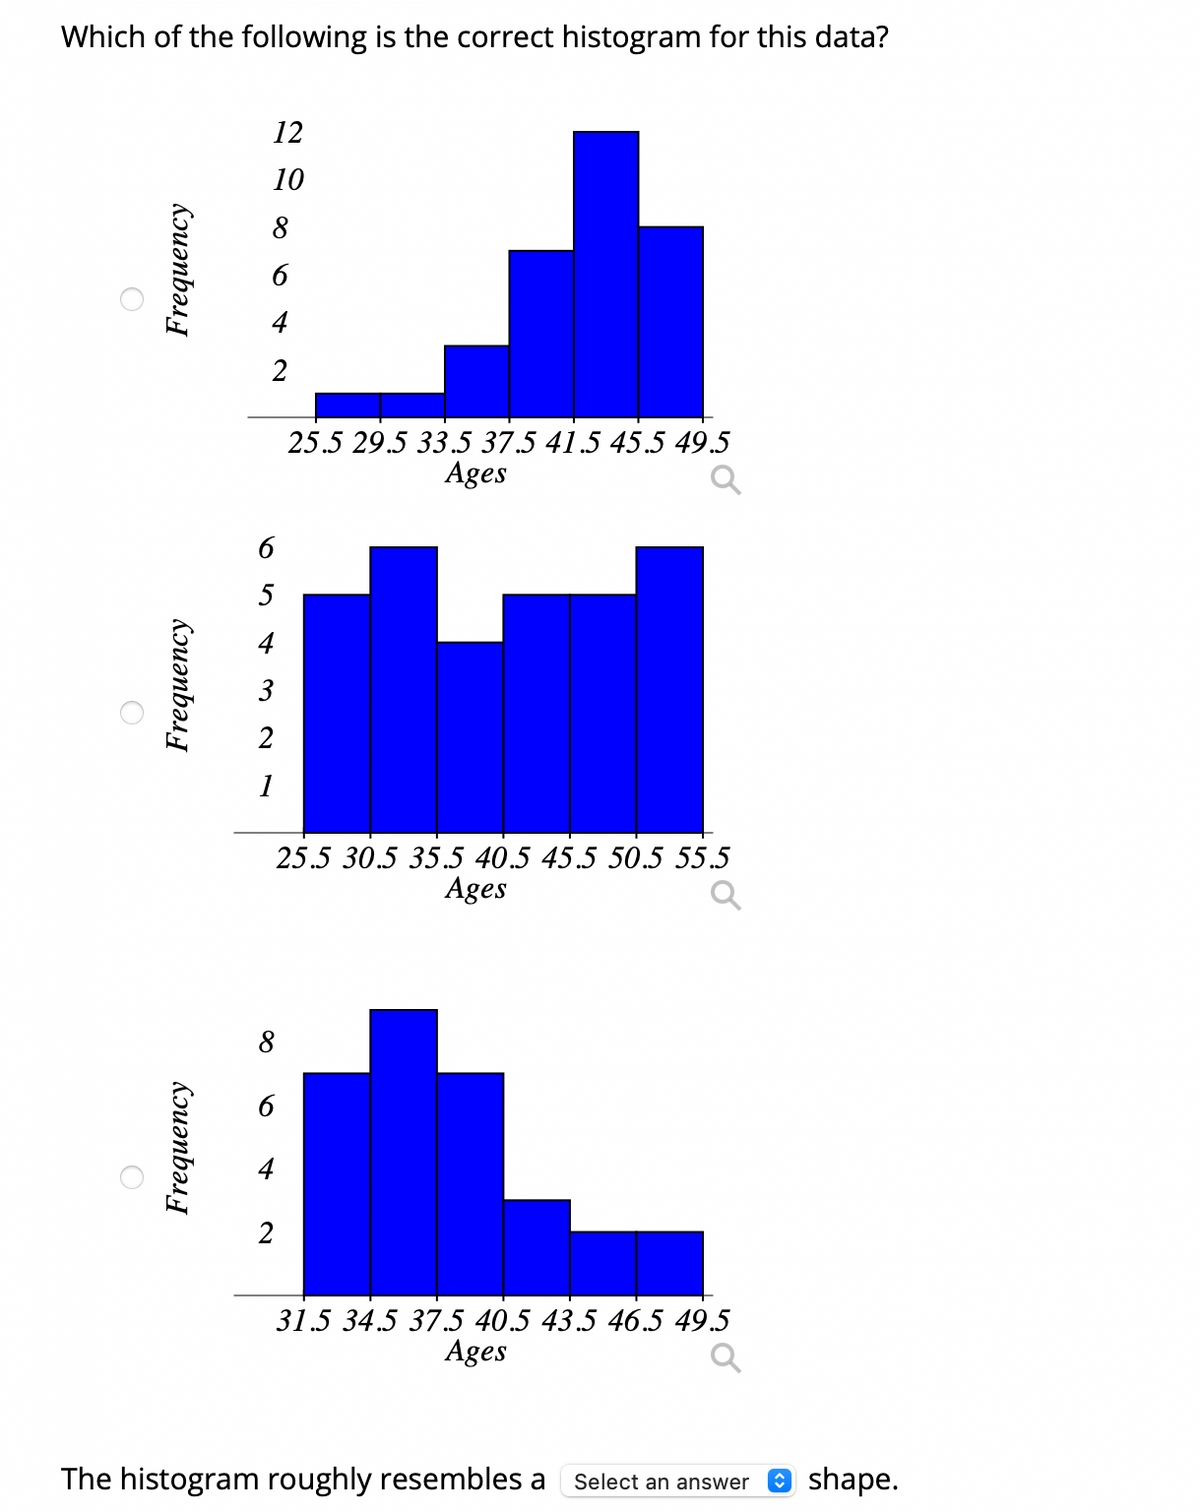
Transcribed Image Text:Which of the following is the correct histogram for this data?
12
10
8
4
2
25.5 29.5 33.5 37.5 41.5 45.5 49.5
Ages
6
5
3
2
1
25.5 30.5 35.5 40.5 45.5 50.5 55.5
Ages
8
2
31.5 34.5 37.5 40.5 43.5 46.5 49.5
Ages
The histogram roughly resembles a
e shape.
Select an answer
Frequency
Frequency
Kouənbəs
Expert Solution
This question has been solved!
Explore an expertly crafted, step-by-step solution for a thorough understanding of key concepts.

This is a popular solution!

Trending now
This is a popular solution!

Step by step
Solved in 5 steps with 4 images

Recommended textbooks for you
Glencoe Algebra 1, Student Edition, 9780079039897…
Algebra
ISBN:
9780079039897
Author:
Carter
Publisher:
McGraw Hill
Glencoe Algebra 1, Student Edition, 9780079039897…
Algebra
ISBN:
9780079039897
Author:
Carter
Publisher:
McGraw Hill