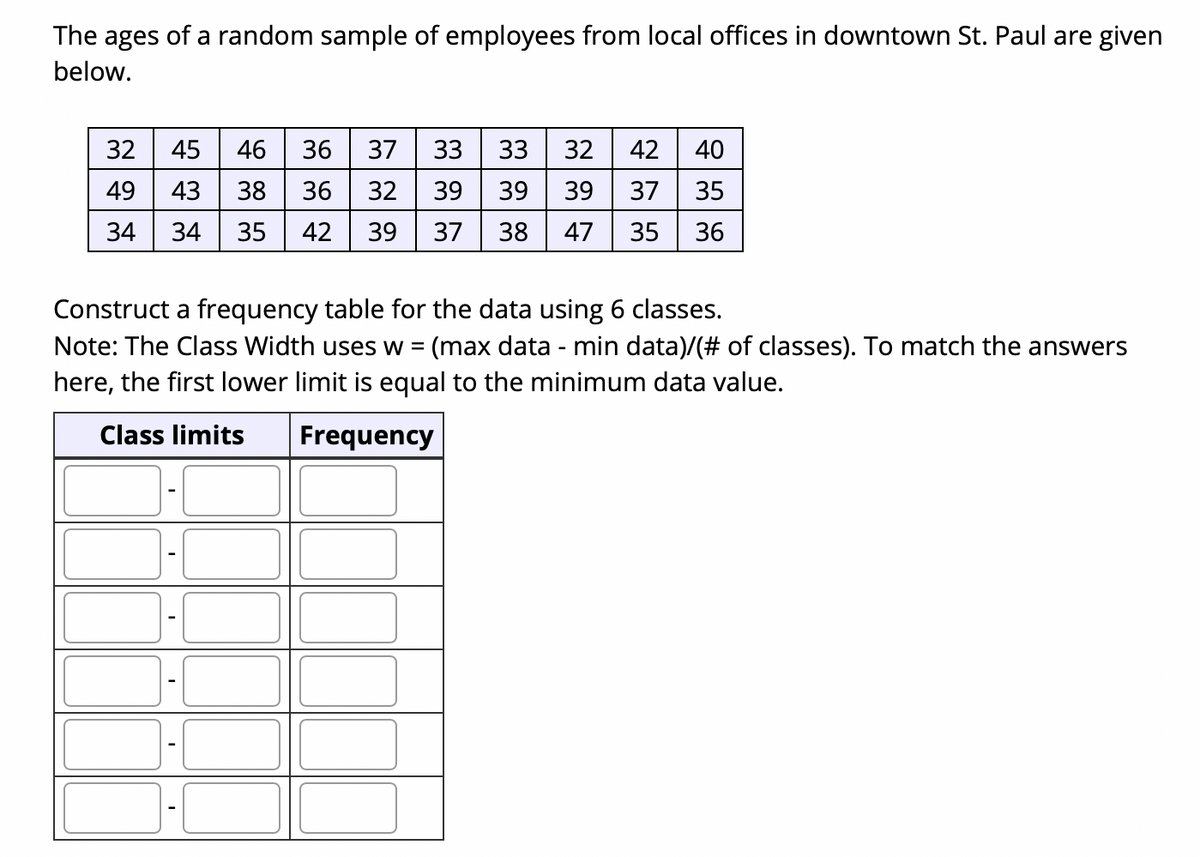
The ages of a random sample of employees from local offices in downtown St. Paul are given below. 32 45 46 36 37 33 33 32 42 40 49 43 38 36 32 39 39 39 37 35 34 34 35 42 39 37 38 47 35 36 Construct a frequency table for the data using 6 classes. Note: The Class Width uses w = (max data - min data)/(# of classes). To match the answers here, the first lower limit is equal to the minimum data value. %3D Class limits Frequency
The ages of a random sample of employees from local offices in downtown St. Paul are given below. 32 45 46 36 37 33 33 32 42 40 49 43 38 36 32 39 39 39 37 35 34 34 35 42 39 37 38 47 35 36 Construct a frequency table for the data using 6 classes. Note: The Class Width uses w = (max data - min data)/(# of classes). To match the answers here, the first lower limit is equal to the minimum data value. %3D Class limits Frequency

Mathematics For Machine Technology
8th Edition
ISBN:9781337798310
Author:Peterson, John.
Publisher:Peterson, John.
Chapter29: Tolerance, Clearance, And Interference
Section: Chapter Questions
Problem 16A: Spacers are manufactured to the mean dimension and tolerance shown in Figure 29-12. An inspector...

Related questions
Question
Transcribed Image Text:The ages of a random sample of employees from local offices in downtown St. Paul are given
below.
42 40
37 35
32
45
46
36
37
33
33
32
49
43
38
36
32
39
39
39
34
34
35
42
39
37
38
47
35
36
Construct a frequency table for the data using 6 classes.
Note: The Class Width uses w =
(max data - min data)/(# of classes). To match the answers
here, the first lower limit is equal to the minimum data value.
Class limits
Frequency
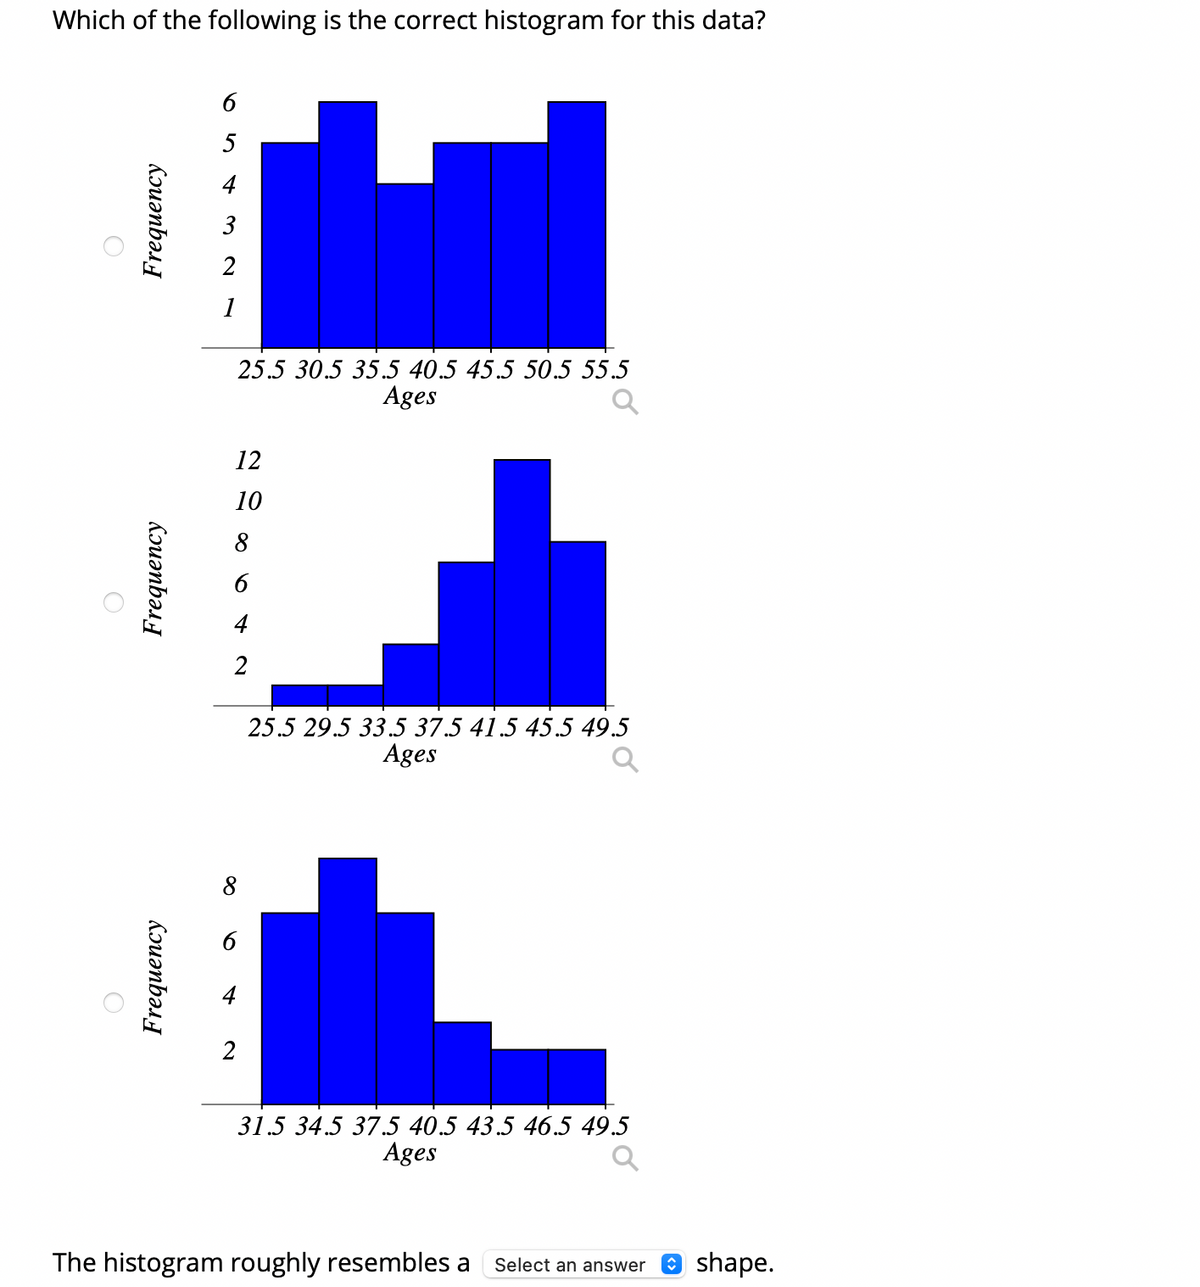
Transcribed Image Text:Which of the following is the correct histogram for this data?
1
25.5 30.5 35.5 40.5 45.5 50.5 55.5
Ages
12
10
8
4
2
25.5 29.5 33.5 37.5 41.5 45.5 49.5
Ages
6
4
2
31.5 34.5 37.5 40.5 43.5 46.5 49.5
Ages
The histogram roughly resembles a
O shape.
Select an answer
654 m ~
Kouənbəs
Kouənbəu
Frequency
Expert Solution
This question has been solved!
Explore an expertly crafted, step-by-step solution for a thorough understanding of key concepts.

This is a popular solution!

Trending now
This is a popular solution!

Step by step
Solved in 2 steps

Recommended textbooks for you
Mathematics For Machine Technology
Advanced Math
ISBN:
9781337798310
Author:
Peterson, John.
Publisher:
Cengage Learning,
Mathematics For Machine Technology
Advanced Math
ISBN:
9781337798310
Author:
Peterson, John.
Publisher:
Cengage Learning,